Scientists have made a contribution when a phenomenon or a statist is named after them. Thus, it is fair to say that Easterlin made a contribution to happiness research because researchers who write about income and happiness often mention his 1974 article “Does Economic Growth Improve the Human Lot? Some Empirical Evidence” (Easterlin, 1974).
To be fair, the article examines the relationship between income and happiness from three perspectives: (a) the correlation between income and happiness across individuals within nations, (b) the correlation of average incomes and average happiness across nations, and (c) the correlation between average income and average happiness within nations over time. A forth perspective, namely the correlation between income and happiness within individuals over time was not examined because no data were available in 1974.
Even for some of the other questions, the data were limited. Here I want to draw attention to Easterlin’s examination of correlations between nations’ wealth and well-being. He draws heavily on Cantril’s seminal contribution to this topic. Cantil (1965) not only developed a measure that can be used to compare well-being across nations, he also used this measure to compare the well-being of 14 nations (Cuba is not included in Table 1 because I did not have new data).
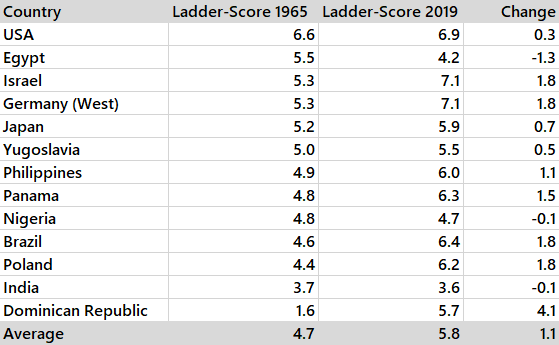
Cantril also correlated the happiness scores with a measure of nations’ wealth. The correlation was r = .5. Cantril also suggested that Cuba and the Dominican Republic were positive and negative outliers, respectively. Excluding these two nations increases the correlation to r = .7.
Easterlin took issue with these results.
“Actually the association between wealth and happiness indicated by Cantril”s international data is not so clear-cut. This is shown by a scatter diagram of the data (Fig. I). The inference about a positive association relies heavily on the observations for India and the United States. [According to Cantril (1965, pp. 130-131), the values for Cuba and the Dominican Republic reflect unusual political circumstances-the immediate aftermath of a successful revolution in Cuba and prolonged political turmoil in the Dominican Republic].

What is perhaps most striking is that the personal happiness ratings for 10 of the 14 countries lie virtually within half a point of the midpoint rating of 5, as is brought out by the broken horizontal lines in the diagram. While a difference of rating of only 0.2 is significant at the 0.05 level, nevertheless there is not much evidence, for these IO countries, of a systematic association between income and happiness. The closeness of the happiness ratings implies also that a similar lack of association would be found between happiness and other economic magnitudes such as income inequality or the rate of change of income.
Nearly 50 years later, it is possible to revisit Easterlin’s challenge of Cantril’s claim that nations’ well-being is tied to their wealth with much better data from the Gallup World Poll. The Gallup World Poll used the same measure of well-being. However, it also provides a better measure of citizens’ wealth by asking for income. In contrast, GDP can be distorted and may not reflect the spending power of the average citizen very well. The data about well-being (World Happiness Report, 2020) and median per capita income (Gallup) are publicly available. All I needed to do was to compute the correlation and make a pretty graph.
The Pearson correlation between income and the ladder scores is r(126) = .75. The rank correlation is r(126) = .80. and the Pearson correlation between the log of income and the ladder scores is r(126) = .85. These results strongly support Cantril’s prediction based on his interpretation of the first cross-national study in the 1960s and refute Eaterlin’s challenge that that this correlation is merely driven by two outliers. Other researchers who analyzed the Gallup World Poll data also reported correlations of r = .8 and showed high stability of nations’ wealth and income over time (Zyphur et al., 2020).
Figure 2 also showed that Easterlin underestimate the range of well-being scores. Even ignoring additional factors like wars, income alone can move well-being from a 4 in one of the poorest countries in the world (Burundi) close to an 8 in one of the richest countries in the world (Norway). It also does not show that Scandinavian countries have a happiness secret. The main reason for their high average well-being appears to be that median personal incomes are very high.

The main conclusion is that social scientists are often biased for a number of reasons. The bias is evident in Easterlin’s interpretation of Cantril’s data. The same anti-materialstic bias can be found in many other articles on this topic that claim the benefits of wealth are limited.
To be clear, a log-function implies that the same amount of wealth buys more well-being in poor countries, but the graph shows no evidence that the benefits of wealth level off. It is also true that the relationship between GDP and happiness over time is more complicated. However, regarding cross-national differences the results are clear. There is a very strong relationship between wealth and well-being. Studies that do not control for this relationship may report spurious relationships that disappear when income is included as a predictor.
Furthermore, the focus on happiness ignores that wealth also buys longer lives. Thus, individuals in richer nations not only have happier lives they also have more happy life years. The current Covid-19 pandemic further increases these inequalities.
In conclusion, one concern about subjective measures of well-being has been that individuals in poor countries may be happy with less and that happiness measures fail to reflect human suffering. This is not the case. Sustainable, global economic growth that raises per capita wealth remains a challenge to improve human well-being.