Social psychologists, among others, have misused the scientific method. Rather than using it to separate false from true hypotheses, they used statistical tests to find and report statistically significant results. The main problem with the search for significance is that significant results are not automatically true discoveries. The probability that a selected significant result is a true discovery also depends on the power of statistical tests to detect a true finding. However, social psychologists have ignored power and often selected significant results from studies with lower power. In this case, significance is often more due to chance than a real effect and the results are difficult to replicate. A shocking finding revealed that less than 25% of results in social psychology could be replicated (OSC, 2015). This finding has been widely cited outside of social psychology, but social psychologists have preferred to ignore the implication that most of their published results may be false (Schimmack, 2020).
Some social psychologists have responded to this replication crisis by increasing power and reporting non-significant results as evidence that effects are small and negligible (e.g., Lai et al., 2014, 2016). However, others continue to use the same old practices. This creates a problem. While the average credibility of social psychology has increased, readers do not know whether they are reading an article that used the scientific method properly or improperly.
One solution to this problem is to examine the strength of the reported statistical results. Strong statistical results are more credible than weak statistical results. Thus, the average strength of the statistical results provides useful information about the credibility of individual articles. I demonstrate this approach with two articles from 2020 in the Attitudes and Social Cognition section of the Journal of Personality and Social Psychology (JPSP-ASC).
Before I examine individual articles, I am presenting results for the entire journal based on automatic extraction of test-statistics for the years 2010 (pre-crisis) and 2020 (post-crisis).
Figure 1 shows the results for 2010. All test-statistics are first converted into p-values and then transformed into absolute z-scores. The higher the z-score, the stronger is the evidence against the null-hypothesis. The figure shows the mode of the distribution of z-scores at a value of 2, which coincides with the criterion for statistical significance (p = .05, two-tailed, z = 1.96). Fitting a model to the distribution of the significant z-scores, we would expect an even higher mode in the region of non-significant results. However, the actual distribution shows a sharp drop in reported z-scores. This pattern shows the influence of selection for significance.

The amount of publication bias is quantified by a comparison of the observed discovery rate (i.e. the percentage of reported tests with significant results and the expected discovery rate, which is the area of the grey curve for z-scores greater than 1.96). The ODR of 73% is much higher than the EDR of 15%. The fact that the confidence intervals for these two estimates do not overlap shows clear evidence of selection for significance in JPSP-ASC in 2010.
An EDR of 15% also implies that most statistical tests are extremely underpowered. Thus, even if there is an effect, it is unlikely to be significant. More relevant is the replication rate, which is the average power of results that were significant. As power determines the outcome of exact replication studies, the replication rate of 60% implies that 60% of published results are expected to be replicable in exact replication studies. However, observed effect sizes are expected to shrink and it is unclear whether the actual effect sizes are practically meaningful or would exceed the typical level of a small effect size (i.e., 0.2 standard deviations or 1% explained variance).
In short, Figure 1 visualizes incorrect use of the scientific method that capitalizes more on chance than on actual effects.
The good news is that research practices in social psychology have changed, as seen in Figure 2.

First, reporting of results is much less deceptive. The observed discovery rate of 73% is close to the estimated discovery rate of 72%. However, visual inspection of the two curves shows a small dip for results that are marginally significant (z = 1.5 to 2) and a slight excess for just significant results (z = 2 to 2.2). Thus, some selection may still happen in some articles.
Another sign of improvement is that the EDR of 72% in 2020 is much higher than the EDR of 15% in 2010. This shows that social psychologists have dramatically improved the power of their studies. This is largely due to the move from small undergraduate samples to larger online samples.
The replication rate of 85% implies that most published results in 2020 are replicable. Even if exact replications are difficult, the EDR of 73% still suggests rather high replicability (see Bartos & Schimmack, 2020, for a discussion of EDR vs. ERR to predict actual replication results).
Despite this positive trend, it is possible that individual articles are less credible than the average results suggest. This is illustrated with the article by Leander et al. (2020).

This article was not picked at random. There are several cues that suggested the results of this article may be less credible than other results. First, Wolfgang Stroebe has been an outspoken defender of the old unscientific practices in social psychology (Stroebe & Strack, 2014). Thus, it was interesting to see whether somebody who so clearly defended bad practices would have changed. This is of course a possibility because it is not clear how much influence Stroebe had on the actual studies. Another reason to be skeptical about this article is that it used priming as an experimental manipulation, although priming has been identified as a literature with many replication failures. The authors cite old priming studies as if there is no problem with these manipulations. Thus, it was interesting to see how credible these new priming results would be. Finally, the article reported many studies and it was interesting to see how the authors addressed the problem that the risk of a non-significant result increases with each additional study (Schimmack, 2012).
I first used the automatically extracted test-statistics for this article. The program found 51 test-statistics. The results are different from the z-curve for all articles in 2020.

Visual inspection shows a peak of p-values that are just significant. The comparison of the ODR of 65% and the EDR of 14% suggests selection for significance. However, even if we just focus on the significant results, the replication rate is low with just 38%, compared to the 85% average for 2020.
I also entered all test-statistics by hand. There were more test-statistics because I was able to use exact p-values and confidence intervals, which are not used by the automated procedure.

The results are very similar showing that automatically extracted values are useful if an article reports results mostly in terms of F and t-values in the text.
The low power of significant results creates a problem for focal hypothesis tests in a serious of studies. This article included 7 studies (1a, 1b, 1c, 2, 3, 4, 5) and reported significant results for all of them, ps = 0.004, 0.007, 0.014, 0.020, 0.041, 0.033, and 0.002. This 100% success rate is higher than the average observed power of these studies, 70%. Average power overestimates real power, when results are selected for significance. A simple correction is to subtract the inflation rate (100% – 70% = 30%) from the mean observed power. This Index is called the Replication Index and an R-Index of 40% shows that studies were underpowered and that a replication study with the same sample size is more likely to produce a non-significant result than a significant one.
A z-curve analysis produce a similar estimate, but also shows that these estimates are very unstable and that replicability could be 5%, which means there is no effect. Thus, after taking selection for significance into account, the 7 significant p-values in Leander et al.’s (2020) article provide as much evidence for their claims as Bem’s (2011) 9 significant p-values did for the claim that priming effects can work when the prime FOLLOWS the behavior.

Judd and Gawronski (2011) argued that they had to accept Bem’s crazy article because (a) it passed critical peer-review and (b) they had to trust the author that results were not selected for significance. Nothing has changed in JPSP-ASC. The only criterion for acceptance is peer-review and trust. Bias tests that have been evaluated whether results are actually credible are not used by peer-reviewers or editors. Thus, readers have to carry out these tests themselves to protect themselves from fake science like Leander et al.’s (2020) priming studies. Readers can still not trust social psychology journals to reject junk science like Bem’s (2011) article.
The second example shows how these tools can also provide evidence that published results are credible, using an article by Zlatev et al. (2020).

The automated method retrieved only 12 test statistics. This is a good sign because hypothesis tests are used sparingly to test only important effects, but it makes it more difficult to get precise estimates for a single article. Thus, article based information should be only used as a heuristic, especially if no other information is available. Nevertheless, the limited information suggests that the results are credible. The Observed discovery rate is even slightly below the estimated discovery rate and both the EDR and ERR are very high, 99%. 5 of the 12 test statistics exceed a z-value of 6 (6 sigma) which is even higher than the 5-sigma rule used on particle physics.

The hand-coding retrieved 22 test statistics. The main reason for the difference is that the automated method does not include chi-square tests to avoid including results from structural equation modeling. However, the results are similar. The ODR of 86% is only slightly higher than the EDR of 74% and the replication rate is estimated to be 95%.
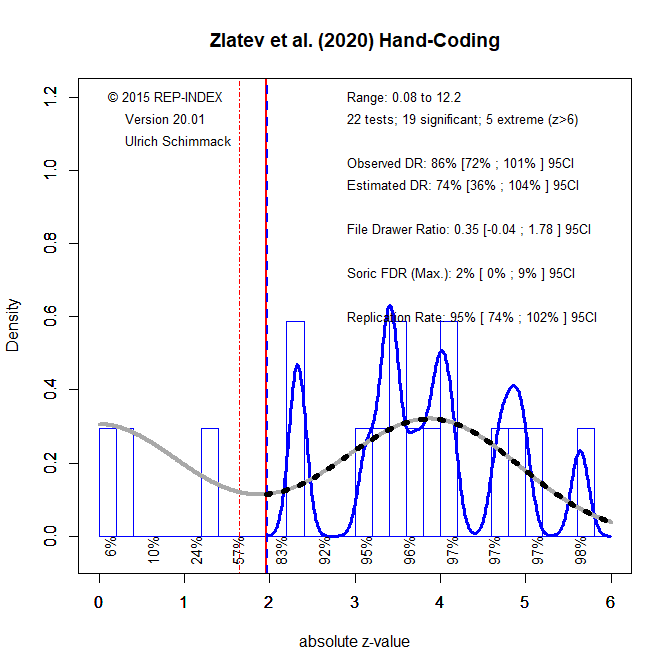
There were six focal tests with four p-values below .001. The other two p-values were .001 and .002. The mean observed power was 96%, which means that a success rate of 100% was justified and that there is very little inflation in the success rate, resulting in an R-Index of 93%.
Conclusion
Psychology, especially social psychology, has a history of publishing significant results that are selected from a larger set of tests with low statistical power. This renders published results difficult to replicate. Despite a reform movement, published articles still rely on three criteria to be published: (a) p-values below .05 for focal tests, (b) peer-review, and (c) trust that researchers did not use questionable practices to inflate effect sizes and type-I error risks. These criteria do not help to distinguish credible and incredible articles.
This blog post shows how post-hoc power analysis can be used to distinguish questionable evidence from credible evidence. Although post-hoc power analysis has been criticized when it is applied to a single test statistic, meta-analyses of observed power can show whether researchers actually had good power or not. It can also be used to provide information about the presence and amount of selection for significance. This can be helpful for readers to focus on articles that published credible and replicable results.
The reason why psychology has been slow in improving is that readers have treated all significant results as equal. This encouraged researchers to p-hack their results just enough to get significance. If readers become more discerning in the reading of method section and no longer treat all p-values below .05 as equal, articles with more credible evidence will gain more attention and citations. For example, this R-Index analysis suggests that readers can ignore Leander et al.’s article and can focus on the credible evidence in Zlatev et al.’s article. Of course, solid empirical results are only a first step in assessing an article. Other questions about ecological validity remain, but there is no point in paying attention to p-hacked results, even if their are published in the most prestigious journal.
P.S. I ran a z-curve analysis on all articles with 10 or more z-scores between 2 and 6 published from 2000 to 2010. The excel file contains the DOI, the observed discovery rate, expected discovery rate, and the expected replication rate. It can be fun to plug a DOI into a search engine and to see what article pops up. I know nobody is going to believe me, but I did not know which article has the lowest EDR of 5% and ERR of 9%, but the result is not surprising. I call it predictive validity of the R-Index.