The New York Times published a map of the United States that shows which states are opening up today on May 1.

I coded these political decisions on a 1 = shut down or restricted to 3 = partial reopening scale and examined numerous predictor variables that might drive the decision to ease restrictions.
Some predictor variables reflect scientific recommendations such as the rate of testing or the number of deaths or urbanization. Others reflect political and economic factors such as the percentage of Trump supporters in the 2016 election.
The two significant predictors were the number of deaths adjusted for population (on a log-scale) and support for Trump in the 2016 election. The amount of testing that is being carried out in different states was not a predictor.

Another model showed that states that have not been affected by Covid-19 are more likely to open. These are states where the population is more religious, White, and rural.
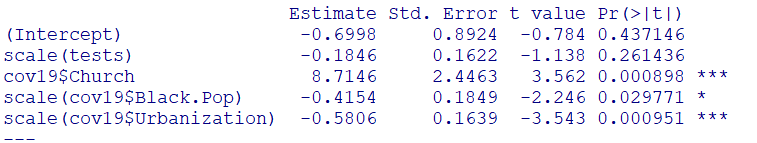
It was not possible to decide which of these variables are driving the effect because predictor variables are too highly correlated. This simply shows the big divide between “red”, rural, religious states and “blue,” agnostic, and urban states.
A bigger problem than differences between states are probably differences within states between urban centers and rural areas, where a single state-wide policy is unlikely to fit the needs of urban and rural populations. A big concern remains that decisions about opening are not related to testing, suggesting that some states who are opening do not have sufficient testing to detect new cases that may start a new epidemic.