An idealistic picture of science views science as an orderly process where disinterested, objective experts look at crystal clear evidence to find the truth. In reality, science is a lot messier. Scientists are human and their values and preexisting theories influence which information they seek out or neglect. Evidence is often inconclusive. As a result, the truth is often elusive. This is especially true in new sciences that lack well-established foundations. In comparison to all other science, Covid-19 science is the newest science that is less than a year old. On top of this, the global, interdisciplinary effort to make sense of Covid-19 data is happening at lightning speed and many participants in this collective effort are not trained epidemiologists. There are simply not enough epidemiologists and many questions that arise are not epidemiological questions. For example, racial disparities in Covid-19 fatalities are extremely important, but it is unlikely that race is a parameter in epidemiological models of a pandemic. The main problem of a new, fast, interdisciplinary science is that a lot of errors will be made. Errors are also part of the scientific process, but a crisis in psychology has demonstrated that it can be difficult to correct errors. Covdi-19 cannot afford costly errors. One reason for high death rates in the United States is that the initial tests did not work well and the virus could spread undetected in NY. Once testing was available it was too late and infections grew exponentially.
One important question for all countries is how effective social distancing is and how important it is to shut schools, close non-essential businesses, and to enforce quarantine and social distancing with laws. In the United States this question is filtered through a political lens with implications for the upcoming 2020 election. Ironically, liberals favor strict laws, whereas conservatives favor less restrictive policies. These preexisting tendencies make it difficult to look at the scientific evidence objectively. I present a graph that compares Kentucky and Tennessee as an example.
Kentucky versus Tennessee
As explained in a newspaper article, this graph was made by Stephanie Jolly from Kentucky and shared with friends on social media (Vergano, 2020). The problem is not Jolly’s graph, but the uncritical sharing of the graph as if it presented hard evidence that imposing stricter social-distancing measures earlier has a strong influence on the spread of Covid-19.
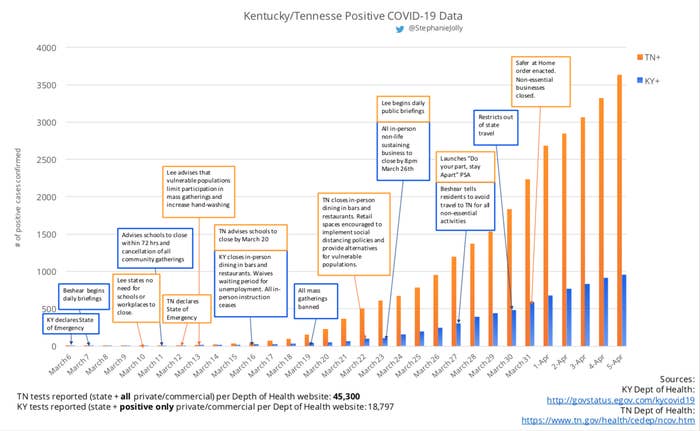
First, we can fact-check the graph using the numbers on the Covid-19 tracking website (https://covidtracking.com/). The website shows 3,633 cases for Tennessee and 917 cases for Kentucky. Thus, there is no mistake with the data, but this does not mean that the Covid-19 pandemic is more severe in Tennessee than in Kentucky. This conclusion requires ruling out alternative explanations for the difference.
The first question is whether Tennessee simply has more inhabitants than Kentucky because states with a larger population will have more cases even if Covid-19 is equally common in both states. Tennessee has 6.8 million inhabitants, while Kentucky has 4.5 million inhabitants. Adjusted for population, Tennessee still has nearly two times as many cases as Kentucky (778 vs. 459 per 1 Million inhabitants).
The next problem is that the number of cases depends on the amount of testing. More testing is considered proactive and important in fighting Covid-19, but states that test more will look worse in a comparison of confirmed cases because they will find more cases. In contrast, a state that doesn’t test at all, would look golden because they report zero Covid-19 cases. As it turns out, Tennessee was actually testing more than Kentucky. On April 5, Tennessee recorded 45,300 tests versus 16,663 tests in Kentucky. The graph below shows the numbers adjusted for population size.

The graph shows that the difference in positives (dark blue vs. dark green) is matched by differences in the amount of testing. To get a better picture of the prevalence of Covid-19 in the two states, it is better to compute the rate of positive test results over the number of tests that were conducted.

Now the two states look more similar. However, there still seems to be a difference after April 3, just in time for different policies to show an effect. This still does not mean that there are real differences between the two states because positive rates are also influenced by the criteria that are used for testing.
One way around the problem with testing is to use deaths as an alternative indicator. If Tennessee has a bigger Covid-19 problem with more cases, we would also expect to see more deaths in Tennessee than in Kentucky. Once more, it is important to take differences in population size into account. When this is done, Tennessee and Kentucky are similar. This is more consistent with the hypothesis that Covid-19 is equally prevalent in the two states and that differences in positive cases are due to different amount of testing.

How is it possible that two states with different policies have similar numbers of Covid-19 cases and deaths? Does this mean social distancing is not effective? Not necessarily. It is also possible that citizens in the two states behaved similar despite differences in official policies. Evidence supports the latter explanation (Vergano, 2020).
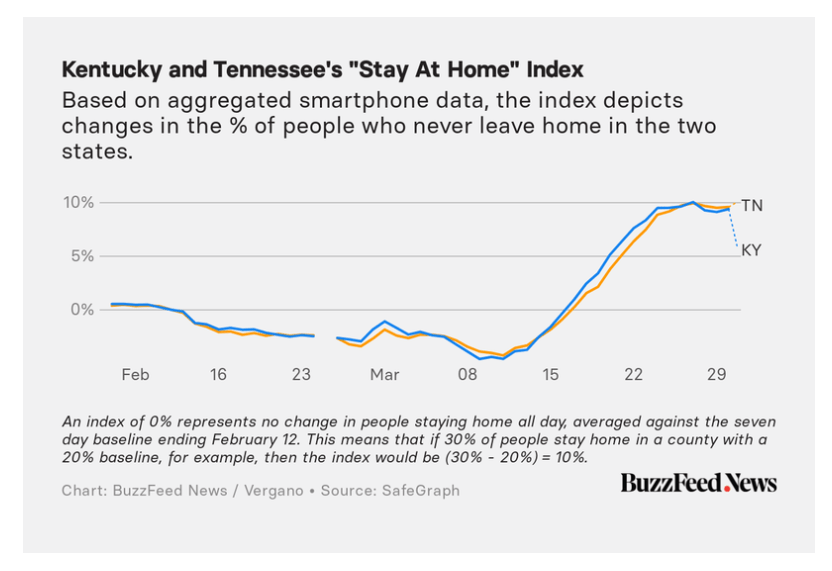
Smartphone data show that citizens in Kentucky and Tennessee responded similarly to the Covid-19 pandemic.
Conclusion
Although Tennessee reported more positive tests of Covid-19 there is no evidence that the virus is more prevalent in Tennessee than in Kentucky. The differences are mostly due to differences in testing. Thus, there is no evidence that differences in government rules influenced Covid-19 spread. As a result, the comparison of these two states cannot be used as a fact to support claims that states that issued stay-at-home orders later or not at all have a higher prevalence of Covid-19 (cf. B. L. Jewell & N. P. Jewell, 2020).
“There is no need to rely on the hypothetical calculations that we have described. The recent divergence of epidemics in Kentucky and Tennessee shows that even a few days’ difference in action can have a big effect. Kentucky’s social distancing measure was issued March 26; Tennessee waited until the last minute of March 31. As Kentucky moved to full statewide measures in reducing infection growth, Tennessee was usually less than a week behind. But as of Friday, the result was stark: Kentucky had 1,693 confirmed cases (379 per million population); Tennessee had 4,862 (712 per million)”
This does not mean that earlier social-distancing measures could have prevented more deaths. As Dr. Anthony Fauci, the director of the National Institute of Allergy and Infectious Diseases, observed, it follows logically that more lives are saved by reducing the spread of a deadly virus.
“Obviously, you could logically say that if you had a process that was ongoing and you started mitigation earlier, you could have saved lives”
This is especially true for places like NY state, where the virus had spread undetected until the WHO declared a pandemic on March 12. Kentucky and Tennessee were relatively lucky that measures taken after March 12 were able to reduce the spread of the virus and to prevent a major disaster. A scientific study of the effects of different policies in different US states on the spreading of Covid-19 is difficult and may never produce conclusive results because there are so many confounding factors.
This is arguably the main contribution that psychological science can make to the stud of Covid-19. Science is a lot harder than collecting some data, making a graph, and telling a story about it. A big part of science is to check facts and to correct claims that turn out to be wrong. A key characteristic of science is that it is self-correcting, but often the process of self-correction is painfully slow. With Covid-19, we don’t have time. So, we need to speed up the self-correction process just as much as we need to speed up the process of hypothesis generation and testing. The best evidence that social-distancing is working – if anybody is doubting this – is that the spread of Covid-19 has slowed down all over the world, including the United States and disaster areas like New York, New Jersey, Michigan, and Louisiana. The reason Tennessee didn’t see more cases is that individuals enacted social distancing earlier than it was mandated by the state government. More data on individuals’ responses to Covid-19 will help to see how important governments’ response to Covid-19. Unfortunately, this will take time and we may have to make decisions without conclusive scientific facts, but at least, we can avoid making decisions on the basis of false facts.
1 thought on “Fake Facts in Covid-19 Science: Kentucky vs. Tennessee”