We are bombarded with statistical information about Covid-19. There is also a lot of uncertainty about the reliability of the data. Case counts are biased by differences in testing. Deaths rates are biased because some coroners because tests are prioritized for the living.
As psychologists, we are used to measurement error; lot’s of it. We deal with this problem by examining whether different measures that are supposed to measure the same thing (construct) are correlated with each other. The more two measures of the spread of the virus are correlated with each other, the more we trust these measures to reflect differences in the spread of the virus across states or provinces. We call this convergent validity.
To examine the validity (a.k.a, trustworthiness) of different Covid-19 statistics, I examined how well these measures correlate across 45 US states and 4 Canadian provinces. Some smaller states/provinces with less reliable data were excluded.
1. One statistic is the simple count of people who tested positive. Of course, this number is influenced by the population of a state or province. To adjust for this, I computed the number of positive cases for every 1 million inhabitants.
2. Another statistic is testing. Testing is important for two reasons. First, more testing is considered a weapon in the fight against Covid 19. Thus, a higher number is desirable. Second, testing can bias the comparison of cases. The more tests are conducted, the more positive cases will be detected. Thus, differences between states and provinces in the number of tests conducted can be a source of measurement error in comparisons of case counts.
3. The positive rate is the percentage of positive tests; that is, positives divided by tests. This measure takes differences in testing into account and can show that a state has a low count of cases simply because they don’t test a lot. Thus, I would expect this to be a more valid measure of the severity of the pandemic in a state.
4. Fatalities. The number of deaths is arguably the most important measure of the pandemic. If nobody would die from COVID-19, we would not have to close schools and shutter non-essential businesses. As for case counts, it is important to divide the absolute number of deaths by the population to make meaningful comparisons of states and provinces. I used the number of deaths for every 10 million inhabitants as a measure.
5. The case-fatality-rate is the proportion of people who test positive and die. Case-fatality rates are important to estimate how deadly COVID-19 is. However, they are strongly influenced by the criteria that are used for testing and the amount of testing that is done. Case-fatality rates can also differ because states differ in terms of medical equipment (ventilators), age of population, or differences in preexisting health conditions.
Table 1 shows the Pearson correlations below the diagonal and rank-order correlations above the diagonal.
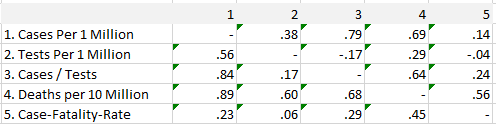
The results show that both cases and deaths are highly correlated with each other, indicating that both measures are valid indicators of the severity of the COVID-19 pandemic across states and provinces.
Not surprisingly, the number of cases is also correlated with the number of tests that are conducted. This suggests that correcting for tests might improve validity. Surprisingly, simple case counts are better predictors of deaths than the positive rate (cases / tests). One possible explanation for this is that the quality of testing data is not very good and introduces a bias in the testing numbers and the positive rates. The data on the Covid tracking site have indeed shown some dramatic changes when reporting of negative results improved (https://covidtracking.com/).
Another surprising finding is that case-fatality rates are virtually unrelated to the amount of testing. This is surprising because wider testing should identify more individuals with mild symptoms who are more likely to survive. This has been used as an explanation for low case-fatality rates in Germany, which tested more than other European countries with higher case fatality rates. The results here suggest that differences in testing may play a smaller role than is commonly assumed. Once more, unreliable testing data may contribute to this finding. Another factor is that testing is related to deaths. In states with a big outbreak like NY, testing has increased a lot more than in states with low fatality rates.
In conclusion, the main finding is that simple case counts are surprisingly, at least to me, valid indicators of the severity of COVID-19 across US states and Canadian provinces, despite big differences in the amount of testing that is carried out. Thus, the number of positive cases and the number of deaths are both valid and important indicators that can be used to compare states and provinces after adjusting for population size.
Isn’t the “case-fatility-rate” actually the proportion of those people who tested positive that HAVE died? In which case it excludes people still living and infected who have the potential to die?