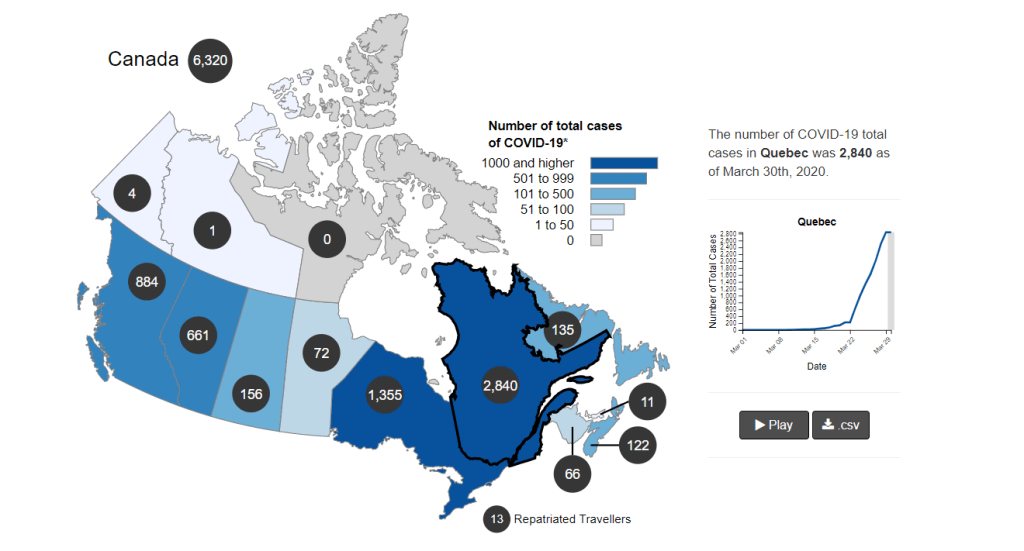
The Covid-19 pandemic is unique because the virus emerged in a globally connected world. This enabled the virus to spread quickly across the globe. At the same time, the ability to fight the virus has never been better. Chinese scientists quickly developed a test to identify infected individuals. This made it possible to isolate infected individuals and prevent the spread of the virus. It also provided an unprecedented amount of data that are widely shared on websites and in the news about the number of COVID-19 positive cases in different countries, the Canadian provinces. For example, the government of Canada keeps Canadian citizens informed on a website that tracks cases and COVID-19 fatalities.
As a psychologist, I wonder what Canadians are learning from these numbers. When I teach psychology, I spend a lot of time explaining what numbers actually mean. My concerns is that Canadians are bombarded with COVID-19 numbers with little information what these numbers actually mean. Every Canadian with some knowledge about Canada will notice that the numbers are bigger for provinces with a larger population, but few Canadians may know the exact population of provinces and are willing to compute the fatality rates of provinces that take population size into account. So, it remains unclear whether the situation is better or worse in Manitoba or Alberta. A simple solution to this problem would be to provide information about the number of cases for every 100,000 people.
Taking population size into account is a step in the right direction, but there is another problem that makes comparisons of provinces difficult. The number of cases that are detected also depends on the number of tests that are done. Alberta rightfully points out that they are world-leaders in the use of testing to fight the spread of COVID-19. While massive testing is positive, it has the negative effect that Alberta is also likely to find more cases than Ontario, where capacity to test the large population of Ontario is more limited. A solution to this problem is to compute the positive rate; that is the number of positive tests over the number of tests conducted. This also makes it unnecessary to take population size into account. Provinces with a larger population are likely to conduct more tests, but what matters is how many tests are being done, not how many people live in a province. A province with a large population could have a low number of cases, if there is very little testing.
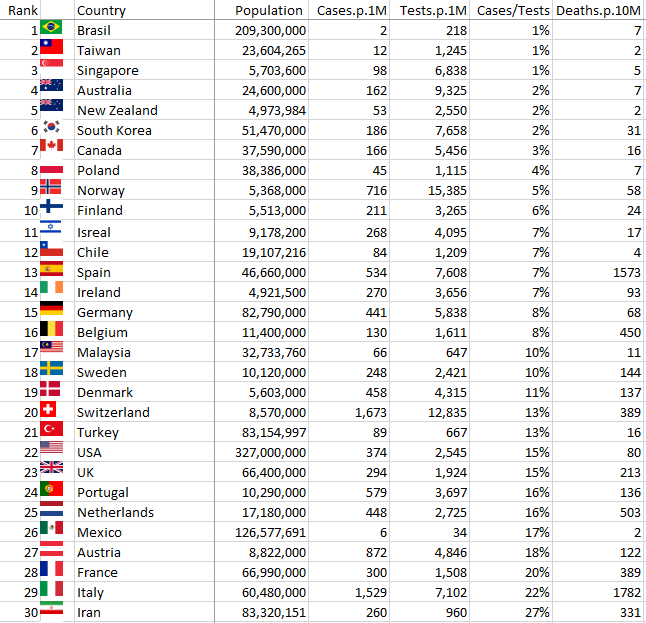
Fortunately, Canadian labs report both the number of positive cases and the number of negative cases. This makes it possible to compute the positive rate as a meaningful statistic to examine the spread of the COVID-19 virus across Canadian provinces. The positive rate can also be used to compare Canadian provinces to the states in the United States. Overall, the United States have had a different response to COVID-19 than Canada. In the beginning, there was a lot less testing than in Canada. Therefore, a simple comparison of the number of positive cases can be very misleading. For example, on March 16, New York reported 49 positive cases for every 1 million inhabitants. Ontario reported 23 positive cases. Taken at face value this suggests that New York already had 2.5 times as many cases. However, NY had only carried out 282 tests per 1 million inhabitants, while Ontario had already carried out 1,044 tests per 1 million inhabitants. This means Ontario had a positive rate of 2%, when NY already had a positive rate of 21%. This means that things were 8 times worse in NY than Ontario, well before cases and fatalities in NY exploded. As of March 28, the numbers in Ontario haven’t changed much. There are now 99 positives for every 1 million inhabitants, but there are also 3,120 tests per inhabitant; a positive rate of 3%. In comparison, NY now has 2,689 positives for 8,016 tests, a positive rate of 34%. This means, things are now 10.5 times worse in NY than in Ontario. Thus, the positive rate reflects that the situation in Ontario is much better than in NY. To summarize, the positive rate controls for differences between provinces and states in the size of a population and the rate of testing that is done. This makes it possible to compare Canadian provinces to each other and with US states. The Table below ranks provinces and states according to the positive rate. The good news for Canadians is that Canada currently has low positive rates, suggesting that early testing, school closures, and social distancing measures have helped to keep COVID-19 in Canada under control. Of course, these numbers are about the present and the future is unknown. However, it is noteworthy that NY already had a positive rate of 17% on March 16, when the situation seemed under control, while COVID-19 was spreading undetected in the community. The good news is that positive rates in Canada are well below this number.

It is worthwhile to discuss Quebec. On March 22, Quebec reported 221 cases with 10,005 tests (positive rate = 2%). On March 23 Quebec reported 628 cases. This was an increase of 187% from the day before with 221 cases. On March 24 numbers increased again dramatically from 628 cases to 1,013 cases. This suggested a big surge in positive cases. However, the next day the number of tests doubled from 13,215 to 27,973, while the number of positive cases increased by only 300 cases. This suggests that some accounting problems produced an artificial surge in cases. Once the increase in tests was taken into account the positive rate on March 25 was 5% and it has remained at this level until March 28. Thus, there is no rampant increase in COVID-19 cases in Quebec, and the spike was a statistical artifact.
The positive rate can also be used to compare Canada to other countries. The Table also includes fatality rates (death / population). The results show that Canada is not only doing better than the United States, but also better than many European countries and the UK, while Australia, New Zealand, and Asian countries are doing better.
It is too early to examine more carefully the reasons for national differences in COVID- 19 cases and fatalities, but the data are encouraging that Canada’s response to the global pandemic has been reasonable and effective. It is also important to avoid politicizing the issue. The liberal federal government and conservative provincial governments have worked together to respond to the crisis. We only have to look South of the border to see how politics can make a global pandemic worse.
Like all statistics, the positive rate is not a perfect measure of the actual spread of COVID-19. One important limitation of the numbers here is that they are based on all cases so far. This means, things might be changing for the better (Norway) or getting worse (UK), and these trends are not reflected in the numbers. Another problem is that positive rates depend on the criteria that are used for testing individuals. However, a low positive rate means that testing is widespread and not just limited to cases in hospitals. Thus, a low positive rate suggests that the virus is not spreading quickly. In contrast, a high positive rate could mean that testing is extremely limited or that there are a lot of cases in the community. However, limited testing is a problem in itself because there is no information about spread in the community. Thus, high numbers are a problem even if a 20% number does not mean that 20% of the population is COVID-19 positive. An alternative measure is the fatality rate. However, once fatality rates are high, the battle against COVID-19 is already lost. The advantage of the positive rate is that it provides information before individuals are dying in large numbers.
Hopefully, school and business closures that were implemented two weeks ago will show some improvement in the numbers in the coming week. Once more, case numbers are the wrong numbers to show this. Case numbers will go up, especially if testing capacities increase. Thus, what we really want to see is a decrease in the number of positive tests. Personally, my analyses of the data give me some hope that we can manage this crisis.
1 thought on “Covid-19 in Canada: What do the Numbers Mean”