A naive model of science is that scientists conduct studies and then report the results. At least for psychological science, this model does not describe the actual research practices. It has been documented repeatedly that psychological scientists pick and choose the results that they report. This explains how psychology journals publish mostly significant results (p < .05) although most studies have only a small chance to produce a significant result. One study found that social psychology journals publish nearly 100% significant results, when the actual chance to do so is only 25% (Open Science Collaboration, 2015). The discrepancy is explained by questionable research practices. Just like magic, questionable research practices can produce stunning results that never happened (Bem, 2011). I therefore compared articles that used QRPs to a magic show (Schimmack, 2012).
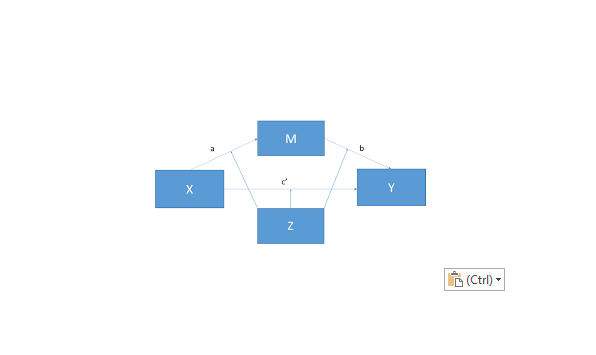
Over the past decades, several methods have been developed to distinguish real findings from magical ones. Applications of these methods have revealed the use of QRPs, especially in experimental social psychology. So far, the focus has been on simple statistical analysis, where an independent variable (e.g., an experimental manipulation) is used to predict variation in a dependent variable. A recent article focused on more complex statistical analysis, called moderated-multiple regression (O’Boyle, Banks, Carter, Walter & Yuan, 2019).
There are two reasons to suspect that moderated-multiple regression results are magical. First, moderated regression requires large sample sizes to have sufficient power to detect small effects (Murphy & Russell, 2016). Second, interaction terms in regression models are optional. Researchers can focus on the main results to publish and add interaction terms only when they produce a significant result. Thus, outcome reporting bias (O’Boyle et al., 2019) is an easy and seemingly harmless QRP that may produce a large file-drawer of studies where moderated-regression was tried, but failed to produce significant results. This is not the only possible QRP. It is also possible to try multiple interaction terms, until a specific combination of variables produces a significant result.
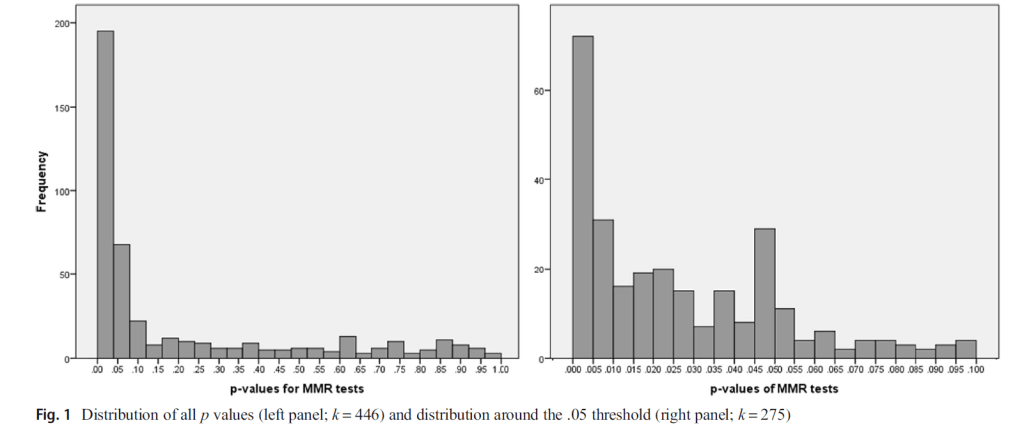
O’Boyle et al. hand-coded results from 343 articles in six management and applied psychology journals that were published between 1995 and 2014. Evidence for the use of QRPs was provided by examining the prevalence of just significant p-values (right figure). There is an unexplained peak just below .05 (.045 to .05).
P-value distributions are less informative about the presence of QRPs than plots of distributions when the p-values are converted into z-scores. O’Boyle et al. shared their data with me and I conducted a z-curve analysis of moderated regression results in applied psychology. The dataset contained information about 449 results that could be used to compute exact p-values. The z-curve plot shows clear evidence of QRPs.
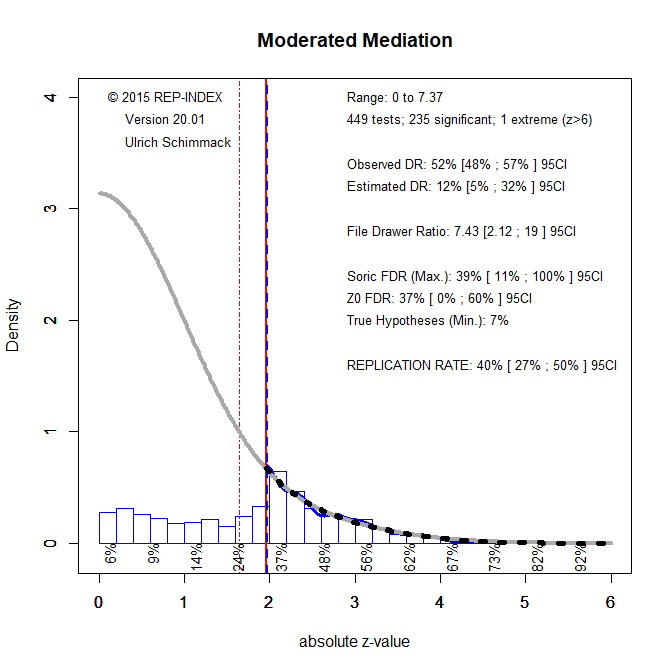
Visual inspections shows a cliff around z = 1.96, which corresponds to a p-value of .05 (two-tailed). This indicates that there should be more non-significant results than are reported. Z-curve also estimates how many non-significant results there should be given the distribution of significant results (grey curve). The plot shows that a much larger number of non-significant results are expected than are actually reported. Z-curve quantifies the use of QRPs by comparing the observed discovery rate (how many reported results are significant) to the expected discovery rate (the area under the gray curve for significant results). The ODR is 52% and the EDR is only 12% and the confidence intervals do not overlap. The 95%CI for the EDR ranges from 5% to 32%. A value of 5% implies that discoveries are at chance level. Thus, based on these results, it is impossible to reject the nil-hypothesis that all significant results are false positives. This does not mean that all of the results are false positives. Soric’s maximum False Discovery Rate is estimated to be 39%, but the 95%CI is very wide and ranges from 11% to 100%. Thus, we simply have insufficient evidence to draw strong conclusions from the data.
Z-curve also computes the expected replication rate (ERR). The ERR is the percentage of analyses with significant results that are expected to produce a significant result again if studies were replicated exactly with the same sample sizes. The ERR is only 40%. One caveat is that it is difficult or impossible to replicate studies in psychology exactly. Bartos and Schimmack (2020) found that the EDR is a better predictor of actual replication outcomes, which suggests only 12% of results would replicate again.
In conclusion, these results confirm suspicions that moderated regression results are magical. Readers should be cautious or entirely ignore these results unless a study has a large sample size and the statistical evidence is strong (p < .001). Magic is fun, but it has no place in scientific journals.For the future, researchers should clearly state that their analyses are exploratory, report outcomes independent of results, or pre-register their data-analysis plan and follow it exactly.
References
Murphy, K. R., & Russell, C. J. (2016). Mend it or end it: Redirecting the search for interactions in the organizational sciences. Organizational Research Methods. 1094428115625322.
O’Boyle, E., Banks, G.C., Carter, K., Walter, S., & Yuan, Z. (2019). A 20-year review of outcome reporting bias in moderated multiple regression. Journal of Business and Psychology, 34, 19–37. https://doi.org/10.1007/s10869-018-9539-8
Thank you for this analysis.