
The “Journal of Experimental Psychology” is the oldest journal of the American Psychological Association (Benjamin, 2019). When psychology grew, it was split into distinct journals for different areas of experimental psychology. IN 2019, the “Journal of Experimental Psychology: Learning, Memory, and Cognition” (JEP-LMC) published its 45th volume. In the same year, Aaron S. Benjamin took over as editor of JEP-LMC.
The editorial promises changes in publication practices in response to the so-called replication crisis in psychology. Concerns about the replicability of psychological findings were raised by the Open Science Collaboration (OSC, 2015). They replicated 100 studies from three journals, including JEP-LMC. For JEP-LMC they found that only 50% of published results produced a significant result in the replication attempts.
Benjamin (2019) hopes that changes in publication policies will raise this replication. He is also hopeful that this can be achieved with minor changes, suggesting that research practices in cognitive psychology are not as questionable as those in social psychology, where the replication rate was only 25%.
Aside from the OSC investigation relatively little is know about the research practices of cognitive psychology and the replicability of their findings. The reason is that systematic examination of replicability are difficult to do. It would take a major effort to repeat the replication project to see whether the replicability of cognitive psychology has already changed or will change in response to Benjamin’s initiatives. Without fast and credible indicators, editors are practically flying blind and can only hope for the best.
My colleagues and I developed a statistical method, called z-curve, to provide fast and representative information about research practices and replicability (Brunner & Schimmack, 2019; Bartos & Schimmack, 2020). Z-curve uses the actual test-statistics (t-values, F-values) of significant results to estimate the expected replication rate (RR) and expected discovery rate (EDR) of published results. The replication rate focuses on published significant result. It estimates how many of these results would be significant again if the original studies were replicated exactly with the same sample sizes. The discovery rate is the rate of significant results for all statistical tests that researchers conducted to produce their publications. Without publication bias, this rate would simply be the percentage of significant results that are reported in articles. However, with publication bias the observed discovery rate is inflated by publication bias. Z-curve provides an estimate of the actual discovery rate on the basis of the distribution of the significant results alone. A comparison of the ODR and EDR provides information about the presence of publication bias or selection for significance.
To provide this valuable information for JEP-LMC, I downloaded all articles from 2000 to 2019 and automatically extracted all test-statistics (t-values, F-values). These test-statistics are first converted into two-sided p-values that are converted into absolute z-scores. Higher z-scores provide stronger evidence against the null-hypothesis. Figure 1 shows the results for the 53,975 test-statistics published from 2000 to 2019.
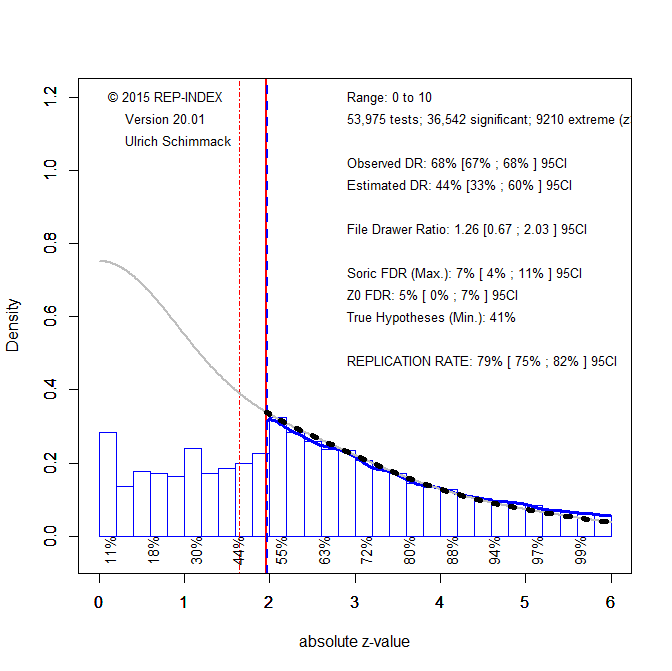
Visual inspection shows a cliff at z = 1.96, which corresponds to a p-value of .05 (two-sided). This finding suggests that non-significant results are missing. A formal test of publication bias is provided by the comparison of the observed discovery rate of 68%, 95%CI = 67% to 68% and the expected discovery rate (EDR) of 44%, 95%CI = 33% to 60%. The confidence intervals do not overlap, indicating that this is not just a random finding. Thus, there is clear evidence that questionable practices inflate the percentage of significant results published in JEP-LMC.
The expected replication rate is high with 79%, 95%CI = 75% to 82%. This estimate is considerably higher than the actual success rate of replication studies of 50% (OSC, 2015). There are several reasons for this. Automatic extraction does not distinguish focal and non-focal hypothesis tests. Focal hypothesis tests are riskier and tend to produce weaker evidence. Estimates for the replicability of results with p-values between .05 and .01 (~ z = 2 to 2.5) show only a replicabilty of 55% (Figures below x-axis). Another reason for the discrepancy is that replication studies are rarely exact, even in cognitive psychology. When unknown moderating factors produce heterogeneity, the ERR overestimates actual replicability and the worst case scenario is that success rate matches the EDR. The 95%CI of the EDR does include 50%. Thus, editors are well advised to focus on the EDR as an indicator for improvement.
Z-curve also provides information about the risk that JEP-LMC publishes mostly false positive results (Benjamin, 2019). Although it is impossible to quantify the rate of true null-hypotheses, it is possible to use the EDR to estimate the maximum rate of false discoveries (Bartos & Schimmack, 2020; Soric, 1980). The Soric FDR is only 7% and even the upper limit of the 95%CI is only 11%. Thus, the results provide no evidence for the claim that most published results are false positives. Power estimates for z-scores between 1 and 2 rather suggest that many non-significant results are false negatives due to low statistical power. This has important implications for the interpretation of interaction effects. Interaction effects rarely show that effects are present in one condition and not in another condition. Most often they merely show that effects are stronger in one condition than in another, even if the weaker effect is not statistically significant.
The presence of questionable practices that inflate the discovery rate affects mostly just-significant results. One way to deal with this problem is to require stronger evidence to claim statistical significance. Just like correction for multiple comparisons, it is necessary to control for unreported tests that inflate the type-I error risk. Following other recommendations, I suggest to use p = .005 as a more stringent criterion to reject the null-hypothesis to contain the false positive risk at 5%. Figure 2 shows the results when only results that meet this criterion (z > 2.8) are fitted to the model.
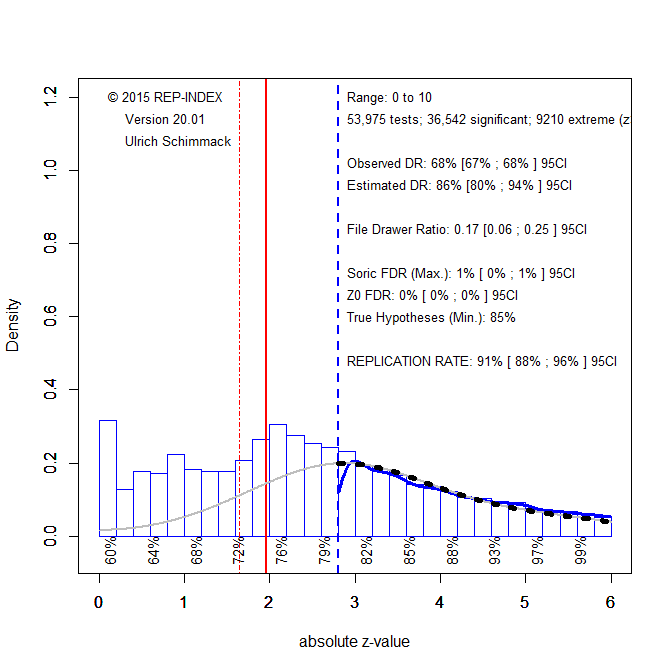
The ERR increases to 91% and the EDR increases to 86%. Even for z-scores from 3 to 3.5, the ERR is 82%. Thus, most of these results are expected to replicate. For the future, this means authors should demonstrate that they did not use QRPs by preregistering and following a design and data analysis plan or they should use the more conservative criterion value of p = .005 to claim significance with alpha = .05.
The published results with p-values between .05 and .005 should be considered as questionable evidence. If multiple studies are available, meta-analyses that take publication bias into account can be used to examine whether these results are robust. If these results are very important, they should be subjected to a rigorous replication attempt in studies with larger samples that increase power.
The next figure examines whether research practices and replicability have changed over time. For this purpose, I computed the ERR (solid) and the EDR (dotted) for results significant at .05 (black) and those significant at .005 (grey) for each year.

Figure 3 shows high ERR and EDR with p < .005 as significance criterion (grey). The slight negative trends are not statistically significant, ERR: b = -.003, se = .0017; EDR: b = -.005, se = .0027. With p < .05 as criterion, the ERR is also high, but significantly decreasing, b = -.0025, se = .001. The EDR estimates are much more variable because they depend on the number of test-statistics that are just significant. The trend over time is negative, but not statistically significant, b = -.005, se = .006. Overall, these results do not show any changes in response to the replication crisis. Hopefully, the initiatives of the editor will reduce the use of questionable practices and increase power. Raising the EDR for all results with p < .05 to 80% can be achieved with less effort. Ironically, a simple way to do so is to publish fewer studies in a single article (Schimmack, 2012). Rather than reporting 8 studies with 25 participants each, results are more credible if they replicate across 4 studies with 50 participants in each study. Thus, without additional resources, it is possible to make results in JEP-LMC more credible and reduce the need to use questionable practices to move p-values below .05.
In conclusion, this blog post provides much needed objective, quantitative (meta-scientific) evidence about research practices and replicability of results in JEP-LMC. The results provide no evidence of a replication crisis in JEP-LMC, and fears that most published results are false positives are not based on empirical facts. Most results published in JEP-LMC are likely to be true and many of the replication failures in the OSC replication attempts were probably false negatives due to low power in both the original and the replication studies. Nevertheless, low power and false negatives are a problem because inconsistent results produce confusion. For powerful within-subject designs cognitive researchers can easily increase power by increasing sample sizes from the typical N = 20 to N = 40. They can do so by reducing the number of internal replication studies within an article or by investing more resources in meaningful conceptual replication studies. Better planning and justification of sample sizes is one of the initiatives in Benjamin’s editorial. Z-curve makes it possible to examine whether this initiative finally increases the power of studies in psychology, which has not been the case since Cohen (1962) warned about low power in psychological experiments. Maybe 60 years later, in 2022, we will see an increase in power in JEP-LMC.