[Updated with corrected figures, 1/27]
[1/29 A revised version has been submitted as a commentary to JEP-General. PDF]
In the 1990s, the prevalent view among psychologists was that false positive results are rare (Cohen, 1994). The main concern was that significance testing is useless because it is known a priori that the nil-hypothesis (i.e., an effect size of zero) is false.
This changed in 2011, when Bem published an article about extrasensory perception, where most psychologists believe the nil-hypothesis is true. Bem’s crazy results suggested that many other published results in psychology might be false positives (Simmons et al., 2011).
Over the years, psychologists have speculated about the false discovery rate in psychology. In addition, there have been attempts to estimate the false discovery rate on the basis of published results. Jerry Brunner and I developed z-curve, which makes it possible to estimate the maximum false discovery rate (Soric, 1989). To do so, we fit a finite mixture model to the distribution of observed z-scores. The results are used to estimate the size of the file-drawer of unpublished non-significant results to estimate the true discovery rate in psychology (i.e., the percentage of significant results out of all statistical tests). The discovery rate is sufficient to estimate the maximum false discovery rate (Soric, 1989).
Wagenmakers and colleagues developed a Bayesian Mixture Model (BMM) to estimate the false discovery rate. The main problem of this model is that it used a dogmatic prior. A dogmatic prior is a prior that limits the range of possible values by assigning a prior probability of 0 to some parameters. The key dogmatic prior of the BMM model is the standard deviation of the true positive results, which has a maximum value of 1. This limits the amount of heterogeneity in power when true hypotheses are being tested.
Example 1
The first example uses the 855 t-tests from cognitive psychology (Wetzel et al., 2011). These data were used by Gronau et al. to estimate the false discovery rate in cognitive psychology. They reported a 95% credibility interval for the false discovery rate ranging from .343 to .464. This result would suggest that at least 34% of published significant results in cognitive psychology are false positives.
In contrast, z-curve produces a maximum false discovery rate of only 8% (see Figure 1).

The figure shows that z-curve fits the observed density distribution of significant results quiet well (compare the blue observed density to the estimated gray density). It also shows the predicted file drawer of missing studies with non-significant results. The file-drawer ratio is 1.47 non-significant results for every published significant result. The expected discovery rate is 40%. Using Soric’s formula, this discovery rate translates into a maximum false discovery rate of 8%. If the definition of a false positive result is widened to include true positives with low power (< 17% power), the maximum false discovery rate doubles to 15%. However, even this estimate is well below the estimate reported by Gronau et al.
Figure 2 shows a z-curve plot with the parameters obtained from the BMM model. The model is a mixture of two normal distributions with SD = 1 and Means of 0 and 4.092. The weights for the two components are 45% and 56%, respectively.

Most important, visual inspection shows that the estimated density distribution does not match the observed density distribution. The estimated distribution rises more steeply due to the assumption that a large portion of the observed values are true positives. At the same time, the assumption of 98% power for true hypothesis does not match the data. It overpredicts high z-scores between 4 and 5, and it underpredicts z-scores in the range between 2.5 and 3.5.
To improve model fit, I removed the restriction on the heterogeneity in power. The parameter estimates for the modified BMM were a false discovery rate of 11.2%, a mean of 0.21, and an SD of 2.82. The fact that SD is well above 1 shows the influence of the dogmatic prior. In addition, model fit improved.

The false discover rate estimate decreased to 11.5%. However, a comparison of Figure 1 and 3 shows that z-curve has better fit than the modified BMM.
The main conclusion is that the BMM restricts heterogeneity in power, which inflates the false discovery rate. When the prior is modified to allow for more heterogeneity in power, even the BMM estimates only 11.5% false positives, and the model better fits the data better. However, z-curve still has better model fit.
Example 2
Wetzel’s t-tests did not distinguish between focal and non-focal tests. The false discovery rate in cognitive psychology might be higher for focal hypotheses tests of novel and risky hypotheses. To examine this possibility, I analyzed a representative sample of focal tests from the Journal of Experimental Psychology: Learning, Memory, and Cognition.
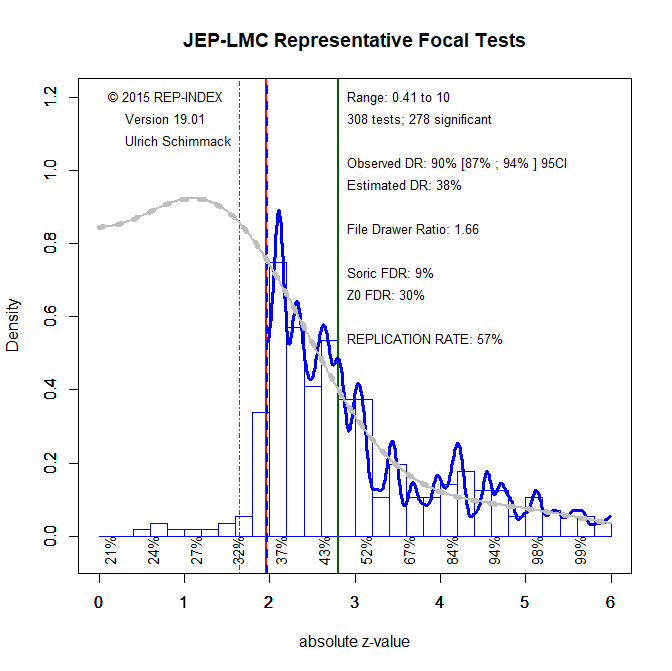
The z-curve plot shows more clearly that focal tests mostly confirm predictions (90% observed discovery rate). The plot also shows that the high success rate is due to selective publishing of significant results. The file-drawer ratio suggests that 1.66 results are not reported for every reported significant result. This leads to an estimated discovery rate of 38%, which translates into maximum false discovery rate of 9% (Soric, 1989).
A dramatically higher estimate of a false discovery rate of 67% is obtained with the BMM.

As expected, the estimate of heterogeneity is at the maximum value of 1. The center of the distribution for true hypothesis is at z = 5.58, which suggests every true positive had 100% power. Thus, the replication rate of 36% is due to a perfectly bimodal distribution with 67% studies with 5% power, and 33% studies with 100% power, 67*.05 + 33 = 36. This makes no sense. The implausible result is caused by the dogmatic prior that restricts heterogeneity in power.

A model with no restriction on the heterogeneity of power produced an SD of 4.46. The mean for the true hypothesis was reduced from 5.58 to 0.19, and the false discovery rate was reduced to 40.6%. The model now had much better fit to the data, but fit was still worse than for the z-curve model. Visual inspection of the graphs shows that the BMM model still overestimates false positives as indicated by the overprediction of z-scores close to 1.96. Thus, the false discovery rate for focal hypothesis tests in cognitive psychology is not 67% or 40% as estimated by the Bayesian Mixture Model, but it is less than 10% as estimates by z-curve.
Conclusion
Wagenmakers and colleagues published a statistical model with the claim that it can be used to estimate the false discovery rate for a set of significant results. The model produced a high FDR for results published in cognitive psychology. This blog post shows that this result is based on an ill-fitting model that is caused by a dogmatic prior on the heterogeneity of power for true hypotheses. Relaxing the dogmatic prior to model actual heterogeneity produced higher estimates of heterogeneity and lower estimates of the FDR, but the model never fits as well as z-curve, which produces low estimates of the maximum FDR for cognitive psychology.
Z-curve and BMM are both mixture models. The main difference between the models is that BMM models true positives with a single normal distribution. In contrast, z-curve uses a finite mixture model with multiple standard normal distributions. This gives the model more flexibility to model non-normal distributions and achieves better fit. The other difference between the published BMM and z-curve is that the published BMM imposes unrealistic restrictions on the heterogeneity of true hypotheses. In contrast, z-curve makes minimal assumptions. However, it cannot estimate a false discovery rate. Instead, it uses the estimated discovery rate to estimate the maximum false discovery rate (Soric, 1989). Evidently, the actual false discovery rate has to be smaller than this estimate, but z-curve estimates of the maximum FDR are lower than estimates of the FDR with the BMM. The reason is that the BMM makes false assumptions that inflate the estimated FDR.
Another difference between z-curve and BMM is that use of Bayesian statistics to obtain estimates with the BMM. As a result, BMM provides credibility intervals, while z-curve uses bootstrapping to obtain confidence intervals (not shown here). With large samples, the differences between credibility intervals and confidence intervals are trivial. With small samples, Bayesian point estimates depend on assumptions about the prevalence of null-hypotheses. Personally, I prefer models without prior assumptions. However, it would be possible to obtain Bayesian z-curve estimates with a Bayesian Finite Mixture Model (BFMM). Thus, the criticism of Wagenmakers’ BMM model should not be considered a criticism of Bayesian statistics in general. Rather, it is a criticism of a dogmatic prior and a model with false distribution assumptions that produces inflated estimates of the false discovery rate in cognitive psychology.
Psychology has a replication crisis, but it does not have a false positive crisis. Many published results in psychology may show the correct sign of an effect, but the published effect sizes are dramatically inflated, while the actual effect sizes may have no practical or theoretical significance. To address this problem, researchers should conduct proper a priori power analyses that result in z-scores clustered around a value of 2.8 for 80% power.
P.S. Wagenmakers’ BMM is published in an empirical psychology journal, not a methods journal. It is not clear what level of statistical expertise the reviewers had to evaluate the manuscript. Given the fundamental flaw in this article, the authors should issue an expression of concern or retract the article. However, I predict that Wagenmakers will respond to this criticism like he responds to all criticism – with silence. In this regard, he is no better than psychologists that failed to respond to Wagenmakers’ criticism of their work. This simply proves that many scientists are unable to correct their mistakes. Thus, for science to be self-correcting, it is necessary that their work is corrected by other scientists.
References
Gronau, Q. F., Duizer, M., Bakker, M., & Wagenmakers, E.-J. (2017). Bayesian mixture modeling of significant p values: A meta-analytic method to estimate the degree of contamination from H₀. Journal of Experimental Psychology: General, 146(9), 1223-1233.http://dx.doi.org/10.1037/xge0000324
1 thought on “Wagenmakers’ Dogmatic Prior Inflates False Discovery Rates”