
“Trust is good, but control is better”
INTRODUCTION
Information about the replicability of published results is important because empirical results can only be used as evidence if the results can be replicated. For example, if a researcher makes 20 attempts to demonstrate an effect and finds 1 significant result, publishing the significant result does not warrant the claim that the finding provides evidence for the effect. It is well known that psychologists selectively publish supporting evidence, while the number of failed attempts remains unknown (Sterling, 1959; Sterling et al., 1995). Thus, p-values less than .05 in psychology journals do not provide information about the risk of false positives and are essentially meaningless (Sterling, 1959).
Brunner and Schimmack (2018) developed a statistical method called z-curve to estimate how replicable a set of significant results are, if the studies were replicated exactly. In a replicability audit, I am applying z-curve to the most cited articles of psychologists to estimate the replicability of their studies. Significant results with high replicability can be interpreted as evidence, while significant results with low replicability provide no empirical support for theoretical claims.
Timothy D. Wilson
Timothy D. Wilson is an eminent social psychologist (H-Index in WebofScience = 44). He is best known as the co-author of the (mostly) theoretical article “Telling more than we can know” in Psychological Review (1977). In this article, Nisbett and Wilson argue that humans have a tendency to provide explanations even when they have insufficient facts. Ironically, the same can be said about experimental social psychologists who often draw strong conclusions about human behavior and information processing on the basis of small laboratory experiments with questionable replicability.
Timothy D. Wilson has also made two contributions to the new field of meta-psychology that examines the behavior and information processing of academic psychologists.
First, Wilson provided some rare insight into his research practices, when Greg Francis demonstrated that the results of one of his article were statistically improbable, suggesting that questionable research practices were used to produce significant results.
In response to Francis, the authors actually admitted that their results were too good to be true because they selectively published significant results.
Yes, of course we ran some studies on “consuming experience” that failed to show interesting effects and are not reported in our JESP paper. Let us be clear: We did not run the same study over and over again until it yielded significant results and then report only the study that “worked.” Doing so would be clearly unethical. Instead, like most researchers who are developing new methods, we did some preliminary studies that used different stimuli and different procedures and that showed no interesting effects. Why didn’t these studies show interesting effects? We’ll never know. Failed studies are often (though not always) inconclusive, which is why they are often (but not always) unpublishable. So yes, we had to mess around for a while to establish a paradigm that was sensitive and powerful enough to observe the effects that we had hypothesized. In one study we might have used foods that didn’t differ sufficiently in quality, in another we might have made the metronome tick too fast for people to chew along. Exactly how good a potato chip should be and exactly how fast a person can chew it are the kinds of mundane things that scientists have to figure out in preliminary testing, and they are the kinds of mundane things that scientists do not normally report in journals (but that they informally share with other scientists who work on similar phenomenon). Looking back at our old data files, it appears that in some cases we went hunting for potentially interesting mediators of our effect (i.e., variables that might make it larger or smaller) and although we replicated the effect, we didn’t succeed in making it larger or smaller. We don’t know why, which is why we don’t describe these blind alleys in our paper.
To be clear, the use of questionable research practices in psychological research is not unethical given the lax standards of research ethics in psychology. I fully agree that the practices described here are “hum-drum ordinary stuff of day-to-day [social psychological] science.” However, the use of questionable practices has the unavoidable consequence that the risk of a type-I error increases and invalidates the reporting of significance as information about the long-run error probability. Moreover, Wilson and colleagues are telling us more than they can know about the factors that produced the pattern of their results. When several studies with low power are conducted, it remains unknown why one study worked (p < .05) and another one did not (p > .05). Apparently, eminent social psychologists have fooled themselves into finding explanations for their results when these patterns might be mostly due to chance. As a result, the theories that they create to explain their possibly random results also tell us much more than the data can tell.
The second contribution of Wilson to meta-psychology was a critical commentary about the replication project by his colleague at the University of Virginia, Brian Nosek, who organized a large collaboration among researchers to replicate a representative sample of studies in social and cognitive psychology. The project successfully replicated 50% of studies in cognitive psychology, but only 25% of published results in social psychology. If the set is limited to studies that used between-subject experiments, the success rate is only 4%.
This finding suggests that questionable research practices rather than strong data explain why social psychology journals publish nearly 100% successes, but replication studies can reproduce less than half of these successes. To avoid the problem of either reporting a failure or engaging in unethical suppression of a failure, social psychologists never examined whether their successes replicated. Every study used a small variation of the previous study so that a failure could be attributed to problems with the new procedure. Avoiding to conduct verification replications of a successful study can be considered another questionable practice.
In a critical commentary, Wilson and colleagues tried to undermine the conclusions of the replication project.
“Depending on the criterion used, only 36 to 47% of the original studies were successfully replicated, which led many to conclude that there is a “replication crisis” in psy-chological science (2). Here, we show that when these results are corrected for error, power, and bias, they provide no support for this conclusion” (Gilbert, King, Pettigrew, & Wilson, 2016).
This claim is incorrect. If 100 studies are selected for significance and then replicated exactly, the percentage of significant results is determined by the statistical power of the original studies (Brunner & Schimmack, 2018). For example, assume half the studies had 20% power and half of the studies had 80% power. In this case, the expected value of successes is .5 * .20 + .5 * .80 = 50%. What does it mean to adjust this estimate for power? The success rate provides exactly the information that we want to know. After selection for significance, we see 100% successes, but we do not know how replicable these successes are. After conducting replication studies, we can see how replicable these successes are. And a 4% success rate for results in between-subject social psychology experiments is not good. After all, we would expect 5% just by chance if all studies reported false positive results.
Data
I used WebofScience to identify the most cited articles by Timothy D. Wilson (datafile ). I then selected empirical articles until the number of coded articles matched the number of citations, resulting in 37 empirical articles (H-Index = 37). The 37 articles reported 110 studies (average 3 studies per article). The total number of participants was 29,536 with a mean of 269 and a median of 74 participants per study. For each study, I identified the most focal hypothesis test (MFHT). The result of the test was converted into an exact p-value and the p-value was then converted into a z-score. The z-scores were submitted to a z-curve analysis to estimate mean power of the 88 results that were significant at p < .05 (two-tailed). Four studies did not test a hypothesis. The remaining 18 results were interpreted as evidence with lower standards of significance. Thus, the success rate for 106 reported hypothesis tests was 100%.
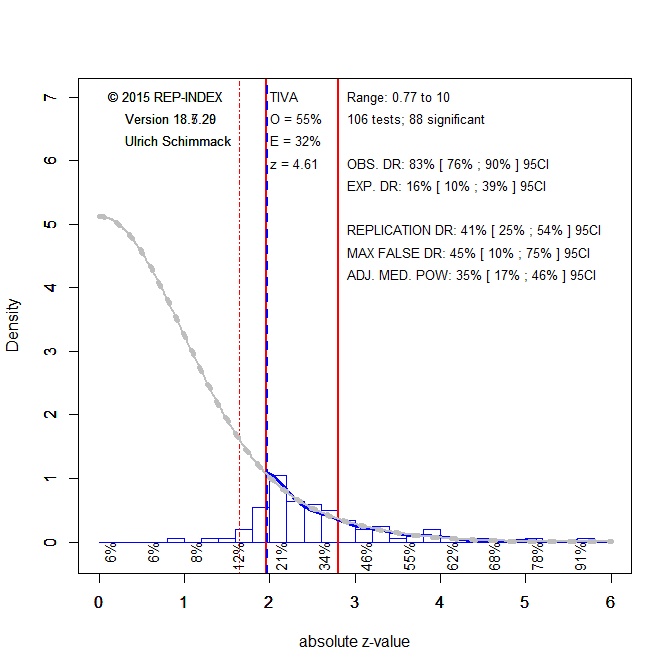
The z-curve estimate of replicability is 41% with a 95%CI ranging from 24%% to 54%. The complementary interpretation of this result is that the actual type-II error rate is 59% compared to the 0% failure rate in the published articles.
The histogram of z-values shows the distribution of observed z-scores (blue line) and the predicted density distribution (grey line). The predicted density distribution is also projected into the range of non-significant results. The large area under the grey curve is an estimate of the file drawer of studies that need to be conducted to achieve 100% successes with 41% average power. Although this is just a projection, the figure makes it clear that Wilson and collaborators used questionable research practices, like those described earlier, to produce significant results.
Z-curve is under development and offers additional information other than the replicabilty of significant results. One new feature is an estimate of the maximum number of false positive results. The maximum percentage of false positive results is estimated to be 45% (95%CI = 10% to 75%). Given the relatively small number of studies, the estimate is not very precise and the upper limit goes as high as 75%. It is unlikely that there are 75% false positives, but the point of empirical research is to reduce the risk of false positives to an acceptable level of 5%. Thus, the actual risk is unacceptably high.
Based on the low overall replicability it would be difficult to identify results that provided credible evidence. However, replicability varies with the strength of evidence against the null-hypothesis; that is, with increasing z-values on the x-axis. Z-curve provides estimates of replicability for different segments of tests. For just significant results with z-scores from 2 to 2.5 (~ p < .05 & p > .01), replicability is just 21%. These studies can be considered preliminary and require verification with confirmatory studies that need much higher sample sizes to have sufficient power to detect an effect (I would not call these studies mere replication studies because the outcome of these studies is uncertain). For z-scores between 2.5 and 3, replicability is still below average with 34%. The nominal type-I error probability of .05 is reached when mean power is above 50%. This is the case only for z-scores greater than 3.5. Thus, after correcting for the use of questionable research practices, only p-values less than .0005 allow rejecting the null-hypothesis with a 5% false positive criterion. Only 15 results meet this criterion (see data file for the actual studies and hypothesis tests).
CONCLUSION
Unlike tax audits by revenue agencies, my replicability audits have no real consequences when questionable research practices are discovered. Timothy D. Wilson followed accepted practices in social psychology and did nothing unethical by the lax standards of research ethics in psychology. That is, he did not commit research fraud. Moreover, non-significant results in replication studies do not mean that the theoretical predictions are wrong. It merely means that the published results provide insufficient evidence for the empirical claim. If all data were reported, z > 2 would allow the conclusion that no more than 5% of predicts could be false. However, given the presence of questionable research practices, the real criterion value that warrants this claim is z > 3.5.
DISCLAIMER
It is nearly certain that I made some mistakes in the coding of Timothy D. Wilson’s articles. However, it is important to distinguish consequential and inconsequential mistakes. I am confident that I did not make consequential errors that would alter the main conclusions of this audit. However, control is better than trust and everybody can audit this audit. The data are openly available and the z-curve code is also openly available. Thus, this replicability audit is fully transparent and open to revision. I actually hope that some independent coding of Wilson’s articles can provide valuable information about interrater reliability of my codings. Evidently, I cannot do this myself.
If you found this audit interesting, you might also be interested in other replicability audits.
Roy F. Baumeister
5 thoughts on “Replicability Audit of Timothy D. Wilson”