Yesterday, Forbes Magazine was happy to tell its readers that “Power Posing Is Back: Amy Cuddy Successfully Refutes Criticism.” I am not blaming a journalist for making a false claim that has been published in the premier journal of the American Psychological Society (APS). My should a journalist be responsible for correcting all the errors that reviewers and the editor who are trained psychological scientists missed. Rather, the Forbes article highlights that APS is more concerned about the image of psychological science than the scientific validity of data and methods that are used to distinguish opinions from scientific facts.
This blog post shows first of all that power posing researchers have used questionable research practices to produce way more significant results than the weak effects and small samples justify. Second, it shows that the meta-analysis used a statistical method that is flawed and overestimates evidence in favor of power-posing effects.
Finally, I point out how a better statistical tool shows that the power-posing literature does not provide credible evidence for replicable effects and cannot be used to make bold claims about the effectiveness of power posing as a way to enhance confidence and performance in stressful situations.
Before I start, I need to make something very clear. I don’t care about power posing or Amy Cuddy and I have a track record of attacking powerful men with flair; not power-posing women (so far, I have been threatened with legal actions by 4 men and 1 women). So, this post has nothing to do with gender. The primary goal is to show problems with the statistical method that Cuddy and colleagues used. This is not their fault. The method has been heavily advertised, although it has never been subjected to peer-review or published in a peer-reviewed journal. On top of this, Jerry Brunner and I have tried to publish our criticism of this method since 2016 and journals have rejected our manuscript because this finding was of insufficient importance. The main point of this blog post is to show that the p-curve meta-analysis by Cuddy et al. is problematic because they used p-curve (which was developed by three men, not a woman). If Cuddy et al. had used z-curve, their conclusions would have been different.
Before I start, I also need to declare a conflict of interest. I am the co-inventor of z-curve and if I am right that z-curve is a lot better than p-curve, it would enhance my reputation and I might benefit from this in the future (so far, I have only suffered from rejections). So, I am presenting my case with a clear bias in favor of zcurve. Whether my arguments are strong or weak, is for the reader to decide.
The main p-curve analysis includes 53 studies. 11 studies had a non-significant result and were not used because p-curve (and z-curve) only use significant results. The Figure shows the pcurve results that were reported in the article.
The key finding is this figure is the reported average power estimate of 44% with a 90%CI ranging from 23% to 63%.
The figure also includes the redundant information that the 90%CI implies that we can safely reject the null-hypothesis (Null of no effect, p < .0001), but not the hypothesis that average power is 33%. After all, 33 falls within the lower bound of 23 and the upper bound of 63 of the 90%CI (p > alpha = 1 – .90 = .10).
The p-curve histogram shows that p-values below .01 are the most frequent p-values compared to p-values for the other four segments in the histogram. This visual information is also redundant with the information that average power is above .05 because any set of studies with average power that is not close to alpha (5%) will show this pattern.
These results are used to support the claim that power-posing has real effects (see quotes below).
Z-curve produces different results and leads to different conclusions. The results that I present here were included in a manuscript that was submitted to a new journal by the American Psychological Society (APS) that also publishes Psychological Science, in which Cuddy’s p-curve analysis was reported. One of the reviewers was a co-author of p-curve, who has just as much a conflict of interest in favor of p-curve as I have in favor of z-curve. So a biased peer-review is partially responsible for the fact that my criticism of p-curve is published as a blog post and not (yet) in a peer-reviewed journal. The zcurve plot below was included in the rejected manuscript. So, readers can make up their own mind whether the rejection was justified or not. Based on this plot, I challenge two claims about power-posing that were made by Cuddy et al. based on their p-curve analysis.
Z-Curve Shows Clear Evidence that Questionable Research Practices were Used by Power-Posing Researchers
Cuddy et al. write “no p-curve analysis by either set of authors yielded results that were left skewed or that suggested that the existing evidence was p-hacked.”
This statement is true, but it overlooks the fact that p-curve is often unable to detect p-hacking and other deceptive practicing like hiding studies that failed to provide evidence for power posing. In contrast, z-curve makes it easy to see the effect of deceptive practices that are euphemistically called “questionable research practices.”
Zcurve makes it easy to detect the influence of QRPs because the z-curve plot (a) includes the non-significant results (on the left of 1.96), (b) distinguishes between marginal significant results that are often used as weak but sufficient support for a hypothesis (z > 1.65 & z < 1.96), and differentiates a lot more among the significant results that are lumped into one category with p < .01 (z > 2.6).
The z-curve plot reveals that we are not looking at a healthy body of evidence. Zcurve projects the model prediction into the range of non-significant results. Although these projections are more biased because they are not based on actual data, the area below the projected curve is very large. In addition, the steep drop from 1.96 to 1.65 in the histogram shows clear evidence that questionable research practices eliminated non-significant results that we would expect from a distribution with a mode at 1.96.
The influence of questionable research practices is also implied by the z-curve estimate of 30% average power for significant results. In contrast, the success rates are 79% if marginally significant results are excluded and 91% if they are included. As power is a predictor of the probability to obtain a significant result, it is implausible that a set of studies with average power of 30% could produce 79% or 91% demonstrations that power posing works. In the best case scenario, the average would be a fixed effect that is true for all studies (each study has 30% power). In this case, we expect to see 2 non-significant results for every significant result (30% successes and 70% failures) and with 42 significant results there should be 84 non-significant results. Even counting the marginally significant ones, we see only 11 non-significant results.
Thus, the claim that there is no evidence for p-hacking in power-posing research is totally inconsistent with the evidence. Not surprisingly, the authors also do not use a validated test of bias, the magic index, to test whether magic was used to produce 91% at least marginally significant results with just 30% power (Schimmack, 2012; also Francis, 2012).
In conclusion, p-curve is not a suitable statistical tool to examine the influence of p-hacking and other deceptive practices. To demonstrate that there is no evidence for these practices with p-curve is like saying that a polar bear does not notice when it snows during hibernation. It is true, but totally irrelevant for the question whether it is snowing or not .
The main aim of p-curve is to examine whether significant results provide evidence (e.g., for power posing effects) even if p-hacking or other deceptive methods were used. Initially this was done by means of significance tests. If p < .05, a set of studies was set to provide evidence for real effects, whereas p > .05 results showed that there was insufficient evidence to reject the alternative hypothesis that questionable research practices alone explained significant results. In other word, the null-hypothesis is that p-hacking alone produced 44 significant results without any real power posing effects.
The problem with relying exclusively on p-values is that p-values are sensitive to the effect size (how strong is the evidence for an effect) and sampling error (how much error is there in the estimated effect size). As sample sizes increase, it gets easier and easier to show that at least some studies contain some evidence, even if the evidence is weak. To address this concern, it is important to complement p-values with information about effect sizes and this can be easily done with confidence intervals. The p-curve result of 44% power tells us that the observed effect size is moderate. It is not close to 5%, which would indicate that all studies are false positives and it is not close to 100%, which would show that all studies are likely to replicate in an exact replication study.
The 90% confidence interval suggests that power could be lower than 44%, but is unlikely to be lower than 23%. At the upper end, the 63% average power also tell us that it is unlikely that the average study had more than 60% power. Thus, power posing studies fall considerably short of the criterion for well-designed studies that they should have 80% power (Cohen, 1988).
It is therefore important to distinguish between two meanings of strong evidence. Cuddy et al. (2018) are justified in claiming that a bias-corrected estimate of 44% average power in a set of 44 significant studies provides strong evidence against the null-hypothesis that all studies are false positive results. However, average power of 44% also shows that each study individually has low power to detect power posing effects.
Like p-curve, z-curve aims to estimate the average power of studies that are selected for significance. The main advantage of z-curve is that it allows for variation in power across studies (heterogeneity). This seems a plausible assumption for a meta-analysis that includes manipulation checks of power feelings and actual outcome measures like risk taking. Evidently, we would expect stronger effects for feelings that are induced by a manipulation aimed at changing feelings than on an outcome like performance in public speaking or risk taking.
The zcurve (same Figure as above is shown here so that you do not have to scroll back and force) provides clear evidence of heterogeneity. Most z-scores pile up close to significance (all z-scores < 2.6 imply p-values greater than .01). However, there are three studies with strong evidence and the range information shows that there are even some (actually only 1, not shown) z-scores with values above 6 (highest value = 7.23).
In our rejected manuscript, we showed with simulation studies that pcurve has problems with strong effects (high z-scores) and pcurve estimates of average increase a lot more than they should when a few studies with very strong evidence are added to a dataset. This estimation bias explains the discrepancy between the pcurve estimate of 44% average power and the zcurvc estimate of 30% average power.
As I already pointed out in the rejected article, the bad behavior of pcurve is evident when the four studies with strong evidence are excluded. The p-curve estimate drops from 44% to 13%. Of course, the average should decrease when the strongest evidence is excluded, but a drop by 31% is not plausible when only four studies are excluded. Going in reverse, if 4 studies with 100% power were added to 40 studies with 13% power, the new average power would be ((40*.13)+(4*1))/44 = 20% average power not 44% power.
In conclusion, the 44% average and the 23% lower bound of the 90% (alpha = 10% type-I error probability) confidence interval reported by Cuddy et al. are inflated because they used a biased tool to estimate average power. Z-curve provides lower estimates of average power and the lower bound of the 95%CI is only 13%.
Even 13% average power in 44 studies would provide strong evidence against the null-hypothesis that all 44 studies are false positives, and 30% average power clearly means that these studies were not all p-hacked false positives. Although this may be considered good news, if we have a cynical view of psychological scientists, the null-hypothesis is also a very low bar to cross. We can reject the hypothesis that 100% of power posing results are p-hacked false positives, but we can also reject the hypothesis that most studies were well-designed studies with 80% power, which would yield a minimum of 40% average power (50% of studies with 80% power yields an average of 40% just for the well powered studies).
Heterogeneity of Power in Power Posing Studies
The presence of heterogeneity in power across power posing studies also has implications for the interpretation of average power. An average of 30% power can be obtained in many different ways. It could be that all studies have 30% power. in this case, all 44 studies with significant results that used different manipulations or outcome variables would show a true positive results. The 30% power estimate would only tell us that the studies had low power and that reported effect sizes are considerably inflated, but all studies are expected to replicate if they were repeated with larger samples to increase power. In other words, there is no need to be concerned about false positive psychology where most published results are false (positives). All results are true positives.
In contrast to this rosy and delusional interpretation of averages, it is also possible that the average is a result of a mixture of false and true positives. In the most extreme case, we can get an average of 30% power with 15 out of 44 (34%) false positive results, if all other studies have 100% power. Even this estimate is only an estimate that depends on numerous assumptions and the percentage of false positives could be higher or lower.
It is also not clear which of the significant results is a false positive and which result would be replicable in larger samples with higher power, So, an average of 30% power tells us only that some of the significant results are true positives, but it does not tell us which studies produced true positives with meaningful effect sizes. Only studies with 80% power or more can be expected to replicate with only slightly attenuated effect sizes. But which power posing studies did have 80% power? The average of 30% does not tell us this.
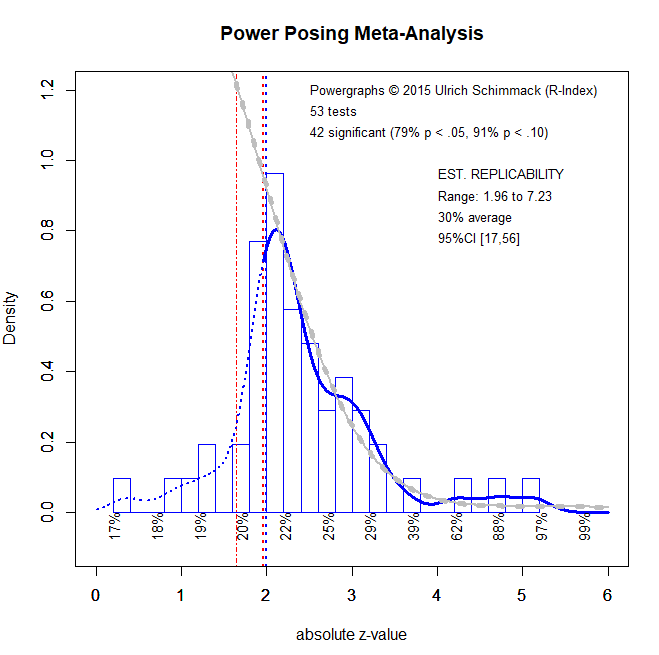
Observed power (or the corresponding z-score) is correlated with true power. The correlation is too weak to use observed power as a reliable indicator of true power for a single study, but in a set of studies, higher z-scores are more likely to reflect higher levels of true power. Z-curve uses this correlation to estimate average power for different regions in the set of significant studies. These estimates are displayed below the x-axis. For z-scores between 2 and 2.5 (roughly .05 and .01), average power is only 22%. However, for z-scores above 4, average power is above 50%. This finding suggests that a small subset of power posing studies is replicable in exact replication studies, whereas the majority of studies has low power and the outcome of replication studies, even with larger samples, is uncertain because some of these studies may be false positives.
Thus modeling heterogeneity has the advantage that it is possible to examine to some extent variability in true power. If all studies had the same power, all segments would have the same estimate. As heterogeneity increases, the true power of just significant results, p < .05 & p > .01, decreases and the power of studies with strong evidence, p < .001 increases. For power-posing a few studies with strong evidence have a strong influence on average power.
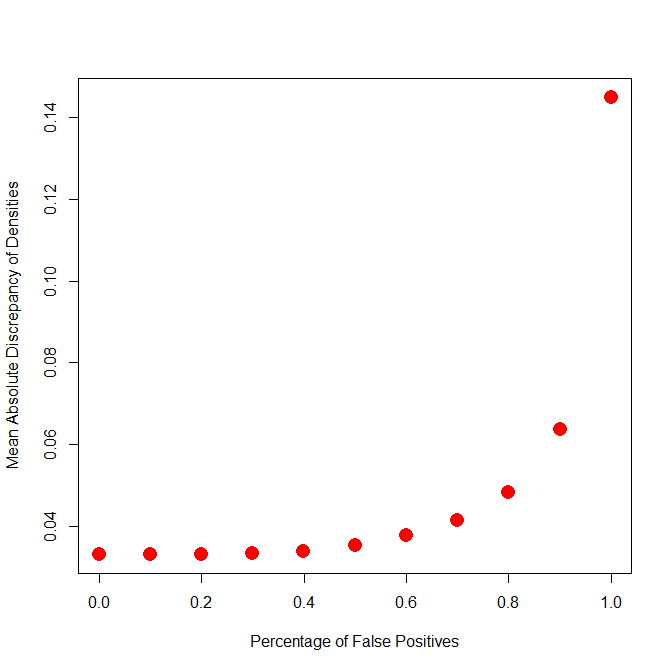
Another novel feature of z-curve (that still needs to be validated with extensive simulation studies) is the ability to fit models that make assumptions about the percentage of false positive results. It is not possible to estimate the actual percentage of false positives, but it is possible to see what the worst case scenario would be. To do so, a new (beta) version of zcurve fits models with 0 to 100% false positives and tries to optimize prediction of the observed distribution of z-scores as much as possible. A model that makes unrealistic assumptions will not fit the data well.
The plot below shows that a model with 100% false positive results does not fit the data. This is already implied by the 95%CI of average power that does not include 5%. The novel contribution of this plot is to see at what point the model can fit the observed distribution with a maximum number of false positives. The scree plot below suggests that models with up to 40% false positives fit the data about as well as a model with 0% false positives. So, it is possible that there are no false positives, but it is also possible that there are up to 40% false positives. In this case, 60% of studies would have about 50% power (.5 * .6 = .30) and 40% would have 5% power (which is the probability of false positives to produce significant results with alpha = 5%; .40 * .05 = .02 = 2%).
In conclusion, it is misleading to interpret average power of 30% as strong evidence if a set of studies is heterogeneous. The reason is that different studies with different manipulations or outcome variables produced different results and the average does not apply to any individual studies. In this way, using the average to draw inferences about individual studies is like stereotyping. Just because a study was drawn from a sample with average power of 30% does not mean that this study has 30% power. At the level of individual studies, most of these studies produced evidence for power posing with the help of luck and questionable research practices and exact replication studies are unlikely to be successful. Thus, any strong conclusions about power posing based on these studies are not supported by strong evidence.
Again, this is not a problem of Cuddy’s analysis. The abstract correctly reports the results of their p-curve analysis.
“Several p-curve analyses based on a systematic review of the current scientific literature on adopting expansive postures reveal strong evidential value for posturalfeedback (i.e., power-posing) effects and particularly robust evidential value for effects on emotional and affective states (e.g., mood and evaluations, attitudes, and feelings about the self).” (Cuddy et al., Psychological Science, 2018)
The problem is that the p-curve analysis is misleading because it does not reveal the strong influence of questionable research practices, it overestimates average power, and it ignores heterogeneity in the strength of evidence across studies.
Peer-Review
Prominent representatives of the American Psychological Society (I am proud not to be a member) have warned about the increasing influence of bloggers that were unkindly called method terrorists. APS wants you to believe that closed and anonymous peer-review is working as a quality control mechanism and that bloggers are frustrated, second grade scientists who are unable to publish in top journals.
The truth is that peer-review is not working. Peer-review works in academia works as well as asking one cat to make sure that the other cat doesn’t eat the chicken, while you are still fixing a salad (enjoy your vegetarian dinner).
The main points about p-curve in general and the power-posing p-curve were made in a manuscript that Jerry Brunner and I submitted to a new journal of APS that claims to represents Open Science and aims to improve scientific standards in psychological science. Given the conflict of interest, I requested that the main author of p-curve should not be a reviewer. The editor responded to this request by making another p-curve author a reviewer and this reviewer submitted a review that ignored major aspects of our criticism of p-curve (including simulation studies that prove our point) and objected to my criticism of the p-curve power posing meta-analysis. The manuscript was rejected without an opportunity to respond to misleading reviewer comments. The main reason for the rejection was that there was insufficient interest in p-curve or z-curve, while at the same time another APS journal had accepted the p-curve paper by Cuddy that is now cited as strong evidence for power posing effects.
Whether this was the right decision or not depends of course on the strength of the arguments that I presented here. As I said, I can only believe that they are strong because I wouldn’t be writing this blog post if I thought they were weak. So, I can only draw (possibly false) inferences about peer-review and APS based on the assumption that I presented strong arguments. Based on this assumption, I feel justified in returning the favor for being branded a method terrorist and for being called out in another APS journal as a hateful blogger.
In response to the reaction by APS representatives to z-curve, I feel justified in calling some areas of psychology, mostly experimental social psychology which I have examined thoroughly, a failed science and APS (and APA) Errorist Organizations (not the t-word that APS representatives used to label critics like me) with no interest in examining errors that psychology science made. I also believe that the rejection of manuscripts that show the validity of zcurve can be explained by fear about what this method may reveal. Just like professional athletes who use performance enhancing substances are afraid of doping tests, scientists who use questionable research methods feel uneasy when a statistical method can reveal these practices. Even if they no longer use doping these days, their past published work is akin to frozen urine samples from the past that reveal massive doping in the past, when doping tests were unable to detect these drugs. Although fear of the truth is just one possible explanation, I find it difficult to come up with alternative explanations for dismissing a method that can examine the credibility and replicability of published findings as uninteresting and irrelevant.
Pepsi and Porsche
P-Curve and Z-Curve have the same objective (there is also an effect size p-curve, but I am focusing on power here). They both aim to estimate average power of a set of studies that were selected for significance. When average power is low (which also implies low heterogeneity) both methods produce similar results and in some simulations p-curve performs slightly better (as we demonstrated ourselves in our own simulations). So, one could think about pcurve and zcurve as two very similar products like pepsi or coke. Not exactly the same but similar enough. Competition between pcurve and zcurve would be mostly limited to marketing (pcurve has an online app, zcurve does not – yet).
However, I hope that I made some convincing arguments why pcurve and zcurve are more like a car and a Porsche (Made in Germany). They both get you to where you want to go most of the time, but a Porsche offers you a lot more. Zcurve is like the Porsche in this analogy, but it is also free (a free online app will be available soon).
Conclusion
My conclusion is that Zcurve is great tool that makes it possible to examine the credibility of published results in published studies. The tool can be applied to any set of studies, whether they are studies of a specific topic or a heterogeneous set of studies published in a journal. It can even be used to estimate the replicability of psychology based on thousands of articles and over a million test statistics and it can reveal whether recent initiatives for rescuing psychological science are actually having an effect on the credibility and replicability of published results.
Whether this conclusion is right or wrong is not for me to decide. This decision will be made by the process called science, but for this process to work, the arguments and the evidence needs to be examined by scientists. APS and APA made it clear that they do not want this to happen in their peer-reviewed, for pay journals, but that will not stop me from exposing zcurve and my reputation to open and harsh criticism, and this blog and many other blog posts on this site allow me to do this.
As always comments are welcome.


