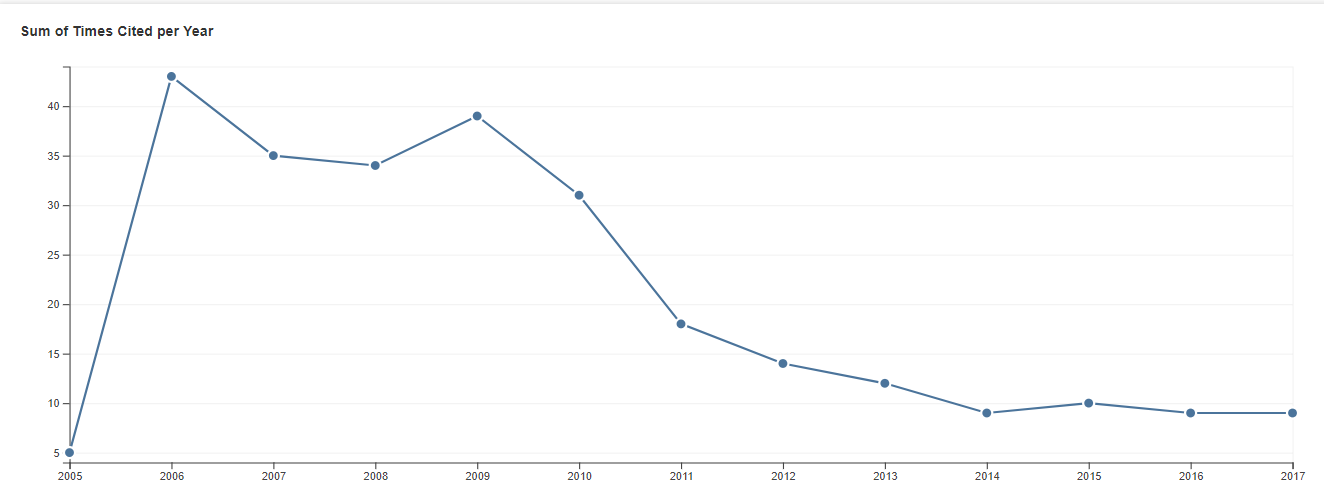
In 2005, Psychological Science published an article titled “An Alternative to Null-Hypothesis Significance Tests” by Peter R. Killeen. The article proposed to replace p-values and significance testing with a new statistic; the probability of replicating an effect (P-rep). The article generated a lot of excitement and for a period from 2006 to 2009, the editor of Psychological Science, James E. Cutting, encouraged reporting p-rep (Author’s Guidelines, 2006).

After some statistical criticism and after a new editor took over Psychological Science, interest in p-rep declined (see Figure).
It is ironic that only a few years later, psychological science would encounter a replication crisis, where several famous experiments did not replicate. Despite much discussion about replicability of psychological science in recent years, Killeen’s attempt to predict replication outcome has been hardly mentioned. This blog post reexamines p-rep in the context of the current replication crisis.
The abstract clearly defines p-rep as an estimate of “the probability of replicating an effect” (p. 345), which is the core meaning of replicability. Factories have high replicability (6 sigma) and produce virtually identical products that work with high probability. However, in empirical research it is not so easy to define what it means to get the same result. So, the first step in estimating replicability is to define the result of a study that a replication study aims to replicate.
“Traditionally, replication has been viewed as a second successful attainment of a significant effect” (Killeen, 2005, p. 349). Viewed from this perspective, p-rep would estimate the probability of obtaining a significant result (p < alpha) after observing a significant result in an original study.
Killeen proposes to change the criterion to the sign of the observed effect size. This implies that p-rep can only be applied to hypothesis with a directional hypothesis (e.g, it does not apply to tests of explained variance). The criterion for a successful replication then becomes observing an effect size with the same sign as the original study.
Although this may appear like a radical change from null-hypothesis significance testing, this is not the case. We can translate the sign criterion into an alpha level of 50% in a one-tailed t-test. For a one-tailed t-test, negative effect sizes have p-values ranging from 1 to .50 and positive effect sizes have p-values ranging from .50 to 0. So, a successful outcome is associated with a p-value below .50 (p < .50).
If we observe a positive effect size in the original study, we can compute the power of obtaining a positive result in a replicating study with a post-hoc power analysis, where we enter information about the standardized effect size, sample size, and alpha = .50, one-tailed.
Using R syntax this can be achieved with the formula:
Pt(obs.es/se,N-2)
with obs.es being the observed standardized effect size (Cohen’s d), N = total sample size, and se = sampling error = 2/sqrt(N).
The similarity to p-rep is apparent, when we look at the formula for p-rep.
Pnorm(obs.es/se/sqrt(2))
There are two differences. First, p-rep uses the standard normal distribution to estimate power. This is a simplification that ignores the degrees of freedom. The more accurate formula for power is the non-central t-distribution that takes the degrees of freedom (N-2) into account. However, even with modest sample sizes of N =40, this simplification has negligible effects on power estimates.
The second difference is that p-rep reduces the non-centrality parameter (effect size/sampling error) by a factor of square-root 2. Without going into the complex reasoning behind this adjustment, the end-result of the adjustment is that p-rep will be lower than the standard power estimate.
Using Killeen’s example on page 347 with d = .5 and N = 20, p-rep = .785. In contrast, the power estimate with alpha = .50 is .861.
The comparison of p-rep with standard power analysis brings up an interesting and unexplored question. “Does p-rep really predict the probability of replication?” (p. 348). Killeen (2005) uses meta-analyses to answer this question. In one example, he found that 70% of studies showed a negative relation between heart rate and aggressive behaviors. The median value of p-rep over those studies was 71%. Two other examples are provided.
A better way to evaluate estimates of replicability is to conduct simulation studies where the true answer is known. For example, a simulation study can simulate 1,000,000 exact replications of Killeen’s example with d = .5 and N = 20 and we can observe how many studies show a positive observed effect size. In a single run of this simulation, 86,842 studies showed a positive sign. Median P-rep (.788) underestimates this actual success rate, whereas median observed power more closely predicts the observed success rate (.861).
This is not surprising. Power analysis is designed to predict the long-term success rate given a population effect size, a criterion value, and sampling error. The adjustment made by Killeen is unnecessary and leads to the wrong prediction.
P-rep applied to Single Studies
It is also peculiar to use meta-analyses to test the performance of p-rep because a meta-analysis implies that many studies have been conducted, whereas the goal of p-rep was to predict the outcome of a single replication study from the outcome of an original study.
This primary aim also explains the adjustment to the non-centrality parameter, which was based on the idea to add the sampling variances of the original and replication study. Finally, Killeen clearly states that the goal of p-rep is to ignore population effect sizes and to define replicability as “an effect of the same sign as that found in the original experiment” (p. 346). This is very different from power analysis, which estimates the probability of an effect of the same sign as the population effect size.
We can evaluate p-rep as a predictor of obtaining effect sizes with the same direction in two studies with another simulation study. Assume that the effect size is d = .20 and the total sample size is also small (N = 20). The median p-rep estimate is 62%.
The 2 x 2 table shows how often the effect sizes of the original study and the replication study match.
| Negative | Positive | |
| Negative | 11% | 22% |
| Positive | 22% | 45% |
The table shows that the original and replication study match only 45% of the time when the sign also matches the population effect size. Another 11% matches occur when the original and the replication study show the wrong sign and future replication studies are more likely to show the opposite effect size. Although these cases meet the definition of replicability with the sign of the original study as criterion, it seems questionable to define a pair of studies that both show the wrong result as a successful replication. Furthermore, the median p-rep estimate of 62% is inconsistent with the correctly matched cases (45%) or the total number of matched cases (45% + 11% = 56%). In conclusion, it is neither sensible to define replicability as consistency between pairs of exact replication studies, nor does p-rep estimate this probability very well.
Can we fix it?
The previous examination of p-rep showed that it is essentially an observed power estimate with alpha = 50% and an attenuated non-centrality parameter. Does this mean we can fix p-rep and turn it into a meaningful statistic? In other words, is it meaningful to compute the probability that future replication studies will reveal the direction of the population effect size by computing power with alpha = 50%?
For example, a research finds an effect size of d = .4 with a total sample size of N = 100. Using a standard t-test, the research can report the traditional p-value; p = .048.
| Negative | Positive | |
| Negative | 0% | 2% |
| Positive | 2% | 96% |
The simulation results show that the most observations show consistent signs in pairs of studies and are also consistent with the population effect size. Median observed power, the new p-rep, is 98%. So, is a high p-rep value a good indicator that future studies will also produce a positive sign?
The main problem with observed power analysis is that it relies on the observed effect size as an estimate of the population effect size. However, in small samples, the difference between observed effect sizes and population effect sizes can be large, which leads to very variable estimates of p-rep. One way to alert readers to the variability in replicability estimates is to provide a confidence interval around the estimate. As p-rep is a function of the observed effect size, this is easily achieved by converting the lower and upper limit of the confidence interval around the effect size into a confidence interval for p-rep. With d = .4 and N = 100 (sampling error = 2/sqrt(100) = .20), the confidence interval of effect sizes ranges from d = .008 to d = .792. The corresponding p-rep values are 52% to 100%.
Importantly, a value of 50% is the lower bound for p-rep and corresponds to determining the direction of the effect by a coin toss. In other words, the point estimate of replicability can be highly misleading because the observed effect size may be considerably lower than the population effect size. This means that reporting the point-estimate of p-rep can give false assurance about replicability, while the confidence interval shows that there is tremendous uncertainty around this estimate.
Understanding Replication Failures
Killeen (2005) pointed out that it can be difficult to understand replication failures using the traditional criterion of obtaining a significant result in the replication study. For example, the original study may have reported a significant result with p = .04 and the replication study produced a non-significant p-value of p = .06. According to the criterion of obtaining a significant result in the replication study, this outcome is a disappointing failure. Of course, there is no meaningful difference between p = .04 and p = .06. It just so happens that they are on opposite sides of an arbitrary criterion value.
Killeen suggests that we can avoid this problem by reporting p-rep. However, p-rep just changes the arbitrary criterion value from p = .05 to d = 0. It is still possible that a replication study will fail because the effect sizes do not match. Whereas the effect size in an original study was d = .05, the effect size in the replication study was d = -.05. In small samples, this is not a meaningful difference in effect sizes, but the outcome constitutes a replication failure.
There is simply no way around making mistakes in inferential statistics. We can only try to minimize them at the expense of reducing sampling error. By setting alpha to 50%, we are reducing type-II errors (failing to support a correct hypothesis) at the expense of increasing the risk of a type-I error (failing to accept the wrong hypothesis), but errors will be made.
P-rep and Publication Bias
Killeen (2005) points out another limitation of p-rep. “One might, of course, be misled by a value of prep that itself cannot be replicated. This can be caused by publication bias against small or negative effects.” (p. 350). Here we see the real problem of raising alpha to 50%. If there is no effect (d = 0), one out of two studies will produce a positive result that can be published. If 100 researchers test an interesting hypothesis in their lab, but only positive results will be published, approximately 50 articles will support a false conclusion, while 50 other articles that showed the opposite result will be hidden in file drawers. A stricter alpha criterion is needed to minimize the rate of false inferences, especially when publication bias is present.
A counter-argument could be that researchers who find a negative result can also publish their results, because positive and negative results are equally publishable. However, this would imply that journals are filled with inconsistent results and research areas with small effects and small samples will publish nearly equal number of studies with positive and negative results. Each article would draw a conclusion based on the results of a single study and try to explain inconsistent with potential moderator variables. By imposing a stricter criterion for sufficient evidence, published results are more consistent and more likely to reflect a true finding. This is especially true, if studies have sufficient power to reduce the risk of type-II errors and if journals do not selectively report studies with positive results.
Does this mean estimating replicability is a bad idea?
Although Killeen’s (2005) main goal was to predict the outcome of a single replication study, he did explore how well median replicability estimates predicted the outcome of meta-analysis. As aggregation across studies reduces sampling error, replicability estimates based on sets of studies can be useful to predict actual success rates in studies (Sterling et al., 1995). The comparison of median observed power with actual success rates can be used to reveal publication bias (Schimmack, 2012) and median observed power is a valid predictor of future study outcomes in the absence of publication bias and for homogeneous sets of studies. More advanced methods even make it possible to estimate replicability when publication bias is present and when the set of studies is heterogenous (Brunner & Schimmack, 2016). So, while p-rep has a number of shortcomings, the idea of estimating replicability deserves further attention.
Conclusion
The rise and fall of p-rep in the first decade of the 2000s tells an interesting story about psychological science. In hindsight, the popularity of p-rep is consistent with an area that focused more on discoveries than on error control. Ideally, every study, no matter how small, would be sufficient to support inferences about human behavior. The criterion to produce a p-value below .05 was deemed an “unfortunate historical commitment to significance testing” (p. 346), when psychologists were only interested in the direction of the observed effect size in their sample. Apparently, there was no need to examine whether the observed effect size in a small sample was consistent with a population effect size or whether the sign would replicate in a series of studies.
Although p-rep never replaced p-values (most published p-rep values convert into p-values below .05), the general principles of significance testing were ignored. Instead of increasing alpha, researchers found ways to lower p-values to meet the alpha = .05 criterion. A decade later, the consequences of this attitude towards significance testing are apparent. Many published findings do not hold up when they are subjected to an actual replication attempt by researchers who are willing to report successes and failures.
In this emerging new era, it is important to teach a new generation of psychologists how to navigate the inescapable problem of inferential statistics: you will make errors. Either you falsely claim a discovery of an effect or you fail to provide sufficient evidence for an effect that does exist. Errors are part of science. How many and what type of errors will be made depends on how scientists conduct their studies.
2 thoughts on “P-REP (2005-2009): Reexamining the experiment to replace p-values with the probability of replicating an effect”