
INTRODUCTION
This post shows the latest replicability rankings of psychological journals.
The following improvements have been made.
1 – The number of journals included in the ranking has doubled from 27 to 54 journals.
2 – The list of journals covers a broader range of psychological disciplines. It now includes journals for cognitive psychology (COG), social psychology (SOC), personality psychology (PER), developmental psychology (DEV), and clinical psychology (CLI).
3 – Replicability scores are now based on F-tests, t-tests, z-tests, correlation and regression coefficients, and confidence intervals.
4 – Replicability scores are reported with the number of tests that were used to compute replicability scores as well as 95% CI based on bootstrap analysis with 500 samples.
5 – The range of z-scores that is used for the computation of replicability scores has been expanded to a limit of z = 6.
6 – The more appropriate heterogeneous model is being used to estimate replicability scores. The heterogeneous model allows for variation the population effect sizes and true power across different analysis.
For more details on the computation of replicability scores see the text below the table and related posts (1, 2, 3, 4).
| Rank | Journal | Area | 2010-2014 | Est. | Low | High | 2015 | Est. | Low | High | Grade | ||
| 1 | Cognitive Psychology | COG | 1733 | 0.72 | 0.69 | 0.75 | 186 | 0.75 | 0.63 | 0.79 | B|C-B | ||
| 2 | Journal of Cross-Cultural Psychology | GEN | 2277 | 0.65 | 0.61 | 0.69 | 238 | 0.74 | 0.66 | 0.79 | B|C-B | ||
| 3 | Journal of Memory & Language | COG | 4729 | 0.67 | 0.64 | 0.69 | 409 | 0.74 | 0.67 | 0.78 | B|C-B | ||
| 4 | Developmental Psychology | DEV | 4083 | 0.65 | 0.62 | 0.67 | 358 | 0.72 | 0.64 | 0.77 | B|C-B↑ | ||
| 5 | JEP: LMC | COG | 7730 | 0.7 | 0.68 | 0.71 | 1323 | 0.71 | 0.68 | 0.75 | B|C-B | ||
| 6 | JEP: Human Percepetion and Performance | COG | 10342 | 0.72 | 0.7 | 0.74 | 1064 | 0.71 | 0.67 | 0.73 | B|C-B | ||
| 7 | Journal of Experimental Psychology: General | GEN | 5045 | 0.65 | 0.62 | 0.67 | 708 | 0.71 | 0.65 | 0.74 | B|C-B? | ||
| 8 | Judgment and Decision Making | COG | 978 | 0.67 | 0.6 | 0.7 | 110 | 0.71 | 0.6 | 0.78 | B|C-B↑ | ||
| 9 | Social Psychology | SOC | 1558 | 0.62 | 0.58 | 0.66 | 146 | 0.71 | 0.62 | 0.78 | B|C-B↑ | ||
| 10 | Archives of Sexual Behavior | GEN | 1271 | 0.7 | 0.66 | 0.74 | 226 | 0.7 | 0.61 | 0.75 | B|C-B | ||
| 11 | Journal of Research in Personality | PER | 2366 | 0.64 | 0.61 | 0.67 | 230 | 0.7 | 0.63 | 0.77 | B|D-B↑ | ||
| 12 | JPSP: Personality Process & Individual Differences | PER | 1735 | 0.59 | 0.54 | 0.62 | 179 | 0.7 | 0.53 | 0.76 | B|D-B↑ | ||
| 13 | Personality and Individual Differences | PER | 5506 | 0.62 | 0.59 | 0.64 | 853 | 0.7 | 0.66 | 0.74 | B|C-B↑ | ||
| 14 | Cognition & Emotion | EMO | 3723 | 0.67 | 0.64 | 0.69 | 773 | 0.69 | 0.64 | 0.73 | C|C-B | ||
| 15 | Depression & Anxiety | CLI | 878 | 0.65 | 0.59 | 0.7 | 227 | 0.68 | 0.6 | 0.74 | C|C-B | ||
| 16 | Aggressive Behavior | GEN | 810 | 0.6 | 0.53 | 0.66 | 81 | 0.67 | 0.54 | 0.77 | C|D-B↑ | ||
| 17 | Personal Relationships | SOC | 1320 | 0.54 | 0.5 | 0.58 | 126 | 0.67 | 0.56 | 0.75 | C|D-B↑ | ||
| 18 | Behavior Research & Therapy | CLI | 3116 | 0.64 | 0.62 | 0.67 | 479 | 0.66 | 0.6 | 0.72 | C|C-B | ||
| 19 | JPSP: Attitude & Social Cognition | SOC | 3550 | 0.54 | 0.5 | 0.58 | 354 | 0.66 | 0.58 | 0.72 | C|D-B↑ | ||
| 20 | Psychology and Aging | DEV | 4422 | 0.71 | 0.69 | 0.73 | 184 | 0.66 | 0.58 | 0.74 | C|D-B↓ | ||
| 21 | Psychology of Music | COG | 693 | 0.64 | 0.59 | 0.69 | 136 | 0.66 | 0.56 | 0.72 | C|D-B | ||
| 22 | Appetite | GEN | 2164 | 0.58 | 0.55 | 0.6 | 384 | 0.64 | 0.6 | 0.72 | C|C-B↑ | ||
| 23 | Cognition | COG | 7744 | 0.65 | 0.63 | 0.67 | 1826 | 0.64 | 0.61 | 0.66 | C|C-C | ||
| 24 | Journal of Applied Psychology | APP | 662 | 0.64 | 0.55 | 0.69 | 173 | 0.64 | 0.54 | 0.72 | C|D-B | ||
| 25 | Social Psychology Personality Science | SOC | 2631 | 0.53 | 0.49 | 0.56 | 174 | 0.64 | 0.56 | 0.74 | C|D-B↑ | ||
| 26 | Journal of Positive Psychology | GEN | 518 | 0.63 | 0.57 | 0.68 | 125 | 0.62 | 0.5 | 0.7 | C|D-B | ||
| 27 | British Journal of Social Psychology | SOC | 1357 | 0.54 | 0.49 | 0.59 | 119 | 0.61 | 0.5 | 0.73 | C|D-B↑ | ||
| 28 | Developmental Science | DEV | 4211 | 0.58 | 0.54 | 0.61 | 318 | 0.61 | 0.52 | 0.67 | C|D-C | ||
| 29 | Journal of Personality | PER | 1338 | 0.52 | 0.48 | 0.55 | 249 | 0.6 | 0.47 | 0.68 | C|F-C↑ | ||
| 30 | Psychological Science | GEN | 7975 | 0.57 | 0.55 | 0.59 | 444 | 0.6 | 0.5 | 0.66 | C|D-C | ||
| 31 | Law and Human Behavior | APP | 891 | 0.67 | 0.63 | 0.71 | 180 | 0.6 | 0.49 | 0.7 | C|F-B↓ | ||
| 32 | Child Development | DEV | 4707 | 0.62 | 0.58 | 0.63 | 493 | 0.59 | 0.49 | 0.64 | D|F-C | ||
| 33 | Infancy | DEV | 1399 | 0.53 | 0.49 | 0.57 | 730 | 0.59 | 0.53 | 0.64 | D|D-C↑ | ||
| 34 | Journal of Experimental Social Psychology | SOC | 8720 | 0.52 | 0.48 | 0.54 | 1182 | 0.59 | 0.5 | 0.62 | D|D-C↑ | ||
| 35 | Motivation and Emotion | EMO | 2410 | 0.63 | 0.6 | 0.65 | 547 | 0.58 | 0.53 | 0.66 | D|D-C↓ | ||
| 36 | Psychophysiology | BIO | 8568 | 0.61 | 0.59 | 0.64 | 1346 | 0.58 | 0.54 | 0.63 | D|D-C↓ | ||
| 37 | Social Development | DEV | 1244 | 0.63 | 0.59 | 0.66 | 218 | 0.58 | 0.48 | 0.66 | D|F-C↓ | ||
| 38 | European Journal of Personality | PER | 400 | 0.67 | 0.61 | 0.72 | 71 | 0.56 | 0.37 | 0.71 | D|F-B↓ | ||
| 39 | Health Psychology | APP | 1503 | 0.56 | 0.52 | 0.6 | 121 | 0.56 | 0.43 | 0.67 | D|F-C | ||
| 40 | Journal of Educational Psychology | APP | 1550 | 0.68 | 0.63 | 0.71 | 295 | 0.56 | 0.47 | 0.64 | D|F-C↓ | ||
| 41 | European Journal of Social Psychology | SOC | 3353 | 0.58 | 0.55 | 0.61 | 350 | 0.55 | 0.47 | 0.62 | D|F-C | ||
| 42 | Journal of Social & Personal Relationships | SOC | 646 | 0.63 | 0.56 | 0.68 | 148 | 0.55 | 0.42 | 0.67 | D|F-C↓ | ||
| 43 | JPSP:Interpersonal Relationships & Group Processes | SOC | 4047 | 0.54 | 0.5 | 0.56 | 468 | 0.55 | 0.47 | 0.62 | D|F-C | ||
| 44 | Organizational Behavior and Decision Processes | APP | 3373 | 0.62 | 0.59 | 0.65 | 608 | 0.55 | 0.49 | 0.61 | D|F-C↓ | ||
| 45 | Personality & Social Psychology Bulletin | SOC | 8737 | 0.54 | 0.52 | 0.56 | 1238 | 0.55 | 0.46 | 0.58 | D|F-D | ||
| 46 | Journal of Child Psychology & Psychiatry | DEV | 1823 | 0.51 | 0.47 | 0.57 | 445 | 0.54 | 0.47 | 0.59 | D|F-D | ||
| 47 | Journal of Consulting and Clinical Psychology | CLI | 1390 | 0.55 | 0.5 | 0.59 | 304 | 0.54 | 0.45 | 0.62 | D|F-C | ||
| 48 | Personnel Psychology | APP | 287 | 0.62 | 0.53 | 0.66 | 72 | 0.54 | 0.33 | 0.68 | D|F|C | ||
| 49 | Journal of Abnormal Psychology | CLI | 2034 | 0.55 | 0.52 | 0.59 | 258 | 0.53 | 0.41 | 0.61 | D|F-C | ||
| 50 | Emotion | EMO | 5695 | 0.62 | 0.6 | 0.64 | 376 | 0.52 | 0.46 | 0.59 | D|F-D↓ | ||
| 51 | Evolution & Human Behavior | GEN | 450 | 0.55 | 0.48 | 0.63 | 56 | 0.51 | 0.29 | 0.72 | D|F|B | ||
| 52 | Social Cognition | SOC | 1830 | 0.57 | 0.52 | 0.6 | 141 | 0.49 | 0.36 | 0.59 | F|F-D↓ | ||
| 53 | Group Processes & Intergroup Relations | SOC | 2059 | 0.53 | 0.51 | 0.57 | 352 | 0.46 | 0.39 | 0.54 | F|F-D↓ | ||
| 54 | Journal of Youth and Adolescence | DEV | 1724 | 0.6 | 0.56 | 0.65 | 282 | 0.46 | 0.33 | 0.5 | F|F-D↓ |
Notes: ↑↓ upward/downward trend if 2015 estimate is outside 2010-2014 confidence interval.
Estimate = Point estimate of bias-corrected power, low/high = 95% confidence interval limits based on 500 bootstrap analyses.
DEFINITION OF KEY TERMS
REPLICABILITY: I define replicability as the probability that an exact replication study with the same population effect size and sample size (and therewith the same true power) produces a significant result. This definition of replicability equates replicability with statistical power. Importantly, a replication study that does not replicate a significant result cannot be interpreted as evidence that an effect does not exist. The non-significant result can occur for several reasons. When replicability is estimated for a heterogeneous set of statistical tests (e.g., tests from different articles in a journal), replicability is the percentage of significant results that can be expected if all of the tests were carried out again in a new set of exact replication studies.
REPORTING BIAS: If journals would publish significant and non-significant results, the percentage of significant results in journals would provide a simple and valid measure of replicability (1, 2). However, psychological journals are much more likely to publish significant results (Sterling, 1959). As a result, published success rates provide biased and inflated estimates of replicability. Replicability rankings use a novel statistical method to correct for reporting bias and estimate the true replicability of significant results published in psychological journals.
DATA
The data were obtained from online published articles in the years from 2010-2015 using 2015 articles that were published online on October 1. The results will be updated when all articles from 2015 are published.
The analysis are based on z-scores in the range from 2 (just above significance criterion of 1.96) and 6. An additional 12% of z-scores with z > 6 were excluded. A z-score of 6 has a probability of 1 in 10 billion to occur when the null-hypothesis is true. Thus, any z-score greater than 6 can be considered to be a real effect and a failed replication (z < 2) would suggest that the two experiments are not exact replications.
The analysis is based on 19,133 articles. Articles were scanned for reports of F-tests, t-tests, z-tests, correlations, regression coefficients, and confidence intervals. The results of these tests were converted into absolute z-scores. The search yielded 182,413 z-scores in the critical range from 2 to 6.
The majority of reported tests were F-tests (n = 100,014) followed by t-tests (n = 59,644), correlations (n = 18,679), z-tests (n = 3278), confidence intervals (n = 540), and regression coefficients with standard errors (n = 258).
The data were submitted to a post-hoc-power analysis. The method relies on the fact that a set of studies with a distribution of true powers produces a characteristic curve of observed z-scores. The shape of this distribution can be used to estimate the average true power based even for a truncated set of observed z-scores. The method is illustrated below for the full set of 273,494 z-scores in the range form 0 to 6 (excluding 12% of data with z > 6), but only the 182,413 z-scores in the range from 2 to 6 are used to estimate average true power.
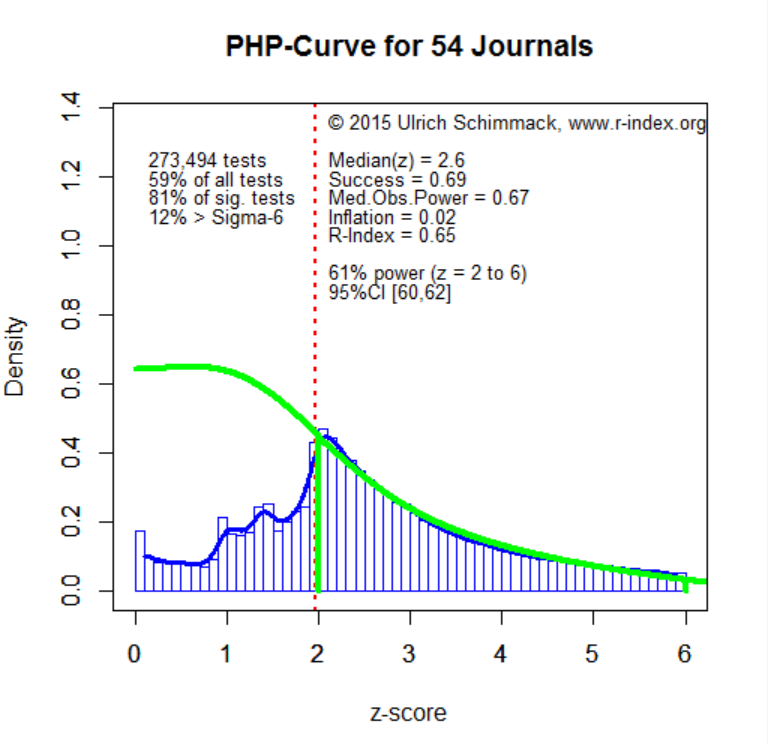
The blue line shows the observed z-scores and the green line shows simulated z-scores of the best fitting model. The best fitting model assigns weights to a set of true power values and uses the weighted average as an estimate of average true power. The estimate is 61%. A bootstrap analysis with 500 trials provides a confidence interval. With over 100,000 observations the interval is small and ranges from 60 to 62%.
The green curve also estimates the number of non-significant results that were obtained but not reported. To estimate the size of the proverbial file-drawer, non-significant results are assigned a single z-score of 1, which corresponds to 17% power. The weight assigned to these non-significant results is determined by the difference between the inflated power and the corrected power estimate. The greater the inflation, the more non-significant results are hidden in file drawers.
If you take requests, here are some other empirical journals that many cognitive psychologists care about:
Memory & Cognition
Psychonomic Bulletin and Review
Attention, Perception, and Psychophysics
Quarterly Journal of Experimental Psychology
Memory
Acta Psychologica
Thanks for the interesting analyses and posts.
Best,
Mike