Bartoš, F., & Schimmack, U. (2022). Z-curve 2.0: Estimating replication rates and discovery rates. Meta-Psychology, 6, Article e0000130. https://doi.org/10.15626/MP.2022.2981
Brunner, J., & Schimmack, U. (2020). Estimating population mean power under conditions of heterogeneity and selection for significance. Meta- Psychology. MP.2018.874, https://doi.org/10.15626/MP.2018.874
van Zwet, E., Gelman, A., Greenland, S., Imbens, G., Schwab, S., & Goodman, S. N. (2024). A New Look at P Values for Randomized Clinical Trials. NEJM evidence, 3(1), EVIDoa2300003. https://doi.org/10.1056/EVIDoa2300003

The Story of Two Z-Curve Models
Erik van Zwet recently posted a critique of the z-curve method on Andrew Gelman’s blog.
Concerns about the z-curve method | Statistical Modeling, Causal Inference, and Social Science
Meaningful discussion of the severity and scope of this critique was difficult in that forum, so I address the issue more carefully here.
van Zwet identified a situation in which z-curve can overestimate the Expected Discovery Rate (EDR) when it is inferred from the distribution of statistically significant z-values. Specifically, when the distribution of significant results is driven primarily by studies with high power, the observed distribution contains little information about the distribution of nonsignificant results. If those nonsignificant results are not reported and z-curve is nevertheless used to infer them from the significant results alone, the method can underestimate the number of missing nonsignificant studies and, as a consequence, overestimate the Expected Discovery Rate (EDR).
This is a genuine limitation, but it is a conditional and diagnosable one. Crucially, the problematic scenarios are directly observable in the data. Problematic data have an increasing or flat slope of the significant z-value distribution and a mode well above the significance threshold. In such cases, z-curve does not silently fail; it signals that inference about missing studies is weak and that EDR estimates should not be trusted.
This is rarely a problem in psychology, where most studies have low power, the mode is at the significance criterion, and the slope decreases, often steeply. This pattern implies a large set of non-significant results and z-curve provides good estimates in these scenarios. It is difficult to estimate distributions of unobserved data, leading to wide confidence intervals around these estimates. However, there is no fixed number of studies that are needed. The relevant question is whether the confidence intervals are informative enough to support meaningful conclusions.
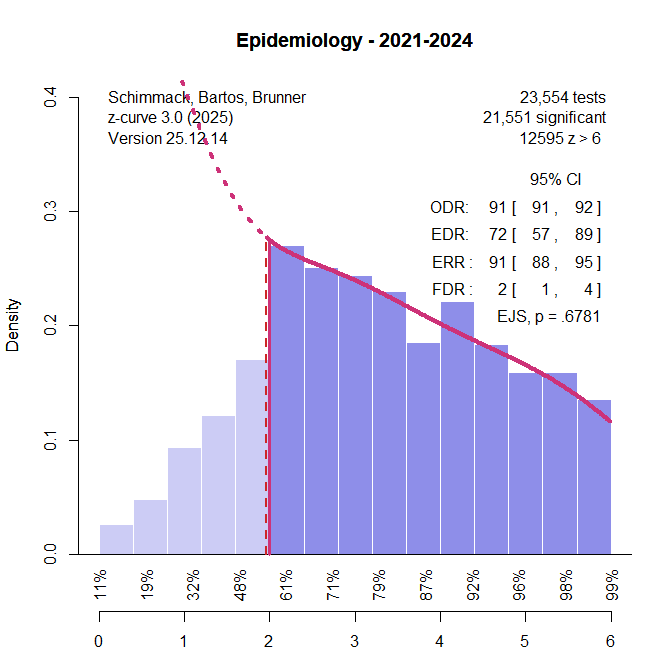
One of the most powerful set of studies that I have actually seen comes from epidemiology, where studies often have large samples to estimate effect sizes precisely. In these studies, power to reject the null hypothesis is actually not really important, but the data serve as a good example of a set of studies with high power, rather than low power as in psychology.
However, even this example shows a decreasing slope and a mode at significance criterion. Fitting z-curve to these data still suggests some selection bias and no underestimation of reported non-significant results. This illustrates how extreme van Zwet’s scenario must be to produce the increasing-slope pattern that undermines EDR estimation.
What about van Zwet’s Z-Curve Method?
It is also noteworthy that van Zwet does not compare our z-curve method (Bartos & Schimmack, 2022; Brunner & Bartos, 2020) to his own z-curve method that was used to analyze z-values from clinical trials (van Zwet et al., 2024).
The article fits a model to the distribution of absolute z-values (ignoring whether results show a benefit or harm to patients). The key differences between the two approaches are that (a) van Zwet et al.’s model uses all z-values and assumes (implicitly) that there is no selection bias, and (b) that true effect sizes are never zero and errors can only be sign errors. Based on these assumptions, the article concludes that no more than 2% of clinical trials produce a result that falsely rejects a true hypothesis. For example, a statistically significant result could be treated as an error only if the true effect has the opposite sign (e.g., the true effect increases smoking, but a significant result is used to claim it reduced smoking).
The advantage of this method is that it is not necessary to estimate the EDR from the distribution of only significant results, but it does so only by assuming that publication bias does not exist. In this case, we can just count the observed non-significant and significant results and use the observed discovery rate to estimate average power and the false positive risk.
The trade-off is clear. z-curve attempts to address selection bias and sometimes lacks sufficient information to do so reliably; van Zwet’s approach achieves stable estimates by assuming the problem away. The former risks imprecision when information is weak; the latter risks bias when its core assumption is violated.
In the example from epidemiology, there is evidence of some publication bias and omission of non-significant results. Using van Zwet’s model would be inappropriate because it would overestimate the true discovery rate. The focus on sign errors alone is also questionable and should be clearly stated as a strong assumption. It implies that significant results in the right direction are not errors, even if effect sizes are close to zero. For example, a significant result that suggests it extends life is considered a true finding, even if the effect size is one day.
False positive rates do not fully solve that problem, but false positive rates that include zero as a hypothetical value for the population effect size are higher and treat small effects close to zero as errors rather than treating half of them as correct rejections of the null hypothesis. For example, an intervention that decreases smoking by 1% of all smokers is not really different from one that increases it by 1%, but a focus on signs treats only the latter one as an error.
In short, van Zwet’s critique identifies a boundary condition for z-curve, not a general failure. At the same time, his own method rests on a stronger and untested assumption—no selection bias—whose violation would invalidate its conclusions entirely. No method is perfect and using a single scenario to imply that a method is always wrong is not a valid argument against any method. By the same logic, van Zwet’s own method could be declared “useless” whenever selection bias exists, which is precisely the point: all methods have scope conditions.
Using proper logic, we suggest that all methods work when assumptions are met. The main point is to test whether they are met or not. We clarified that z-curve estimation of the EDR assumes that enough low powered studies produced significant results to influence the distribution of significant results. If the slope of significant results is not decreasing, this assumption does not hold and z-curve should not be used to estimate the EDR. Similarly, users of van Zwets first method should first test whether selection bias is present and not use it when it does. They should also examine whether they think a proportion of studies could have tested practically true null hypotheses and not use the method when this is a concern.
Finally, the blog post responds to Gelman’s polemic about our z-curve method and earlier work by Jager and Leek (2014), by noting that Gelman’s critic of other methods exist in parallel to his own work (at least co-authorship) that also modeled distribution of z-values to make claims about power and the risk of false inferences. The assumption of this model that selection bias does not exist is peculiar, given Gelman’s typical writing about low power and the negative effects of selection for significance. A more constructive discussion would apply the same critical standards to all methods—including one’s own.