Scientific progress has been slow because humans are not disinterested processors of information. Once they have concluded that some belief is true, their information processing is biased towards verifying that truth rather than looking for disconfirming evidence.
Willful ignorance is the selective processing of confirmatory information and the avoidance of sources that may expose the believer to contradictory information. However, sometimes challenging information is unavoidable. Scientists who want to publish their work are constantly exposed to negative comments. When confronted with criticism, there are a number of strategies that serve different purposes. A constructive response examines the validity of the criticism, responds to valid concerns, adjusts claims accordingly, and may still make a useful contribution. A defensive response to valid criticism engages in pseudo-scientific arguments that avoid the key concern and leads to an unproductive exchange that cannot have a resolution because the goal is to maintain a false belief.
While critics initiate a discussion about potential errors, the roles are not fixed. Once the criticism is made, the person criticized responds to it and may find errors in the critic’s arguments. Now the roles are reversed and the critic may respond to this criticism in defensive ways, accusing the person being criticized of being defensive. This exchange quickly deteriorates into a childish exchange of shouting “I am right. You are wrong” at each other. A more mature response is to allow for errors being made on both sides and carefully examine the arguments. This is the aim of my response to Erik van Zwet’s second blog post about z-curve, “More concerns about z-curve.“
The Substance
In this second post, Erik reports one new simulation scenario. In that scenario, he points to two problems. The main criticism is that the confidence interval for the Expected Discovery Rate (EDR) does not achieve its nominal 95% coverage. The second concern is that the confidence interval for the null-component weight can collapse to zero width, which he interprets as a sign of instability or misspecification in the internal mixture fit.
The second point is the less important one. Z-curve is a finite-mixture model that approximates the distribution of test statistics using weights on several discrete components. It is well understood that these component weights are not themselves substantively meaningful parameters when the true data-generating process is continuous. Different mixtures can yield nearly identical estimates of the quantities z-curve is designed to recover. For that reason, poor coverage of confidence intervals for individual component weights is not, by itself, a serious problem. In particular, the weight of the zero component is not used in z-curve the way a null-component weight is used in models that directly estimate false positive rates. These intervals appear in the output, but they are not the primary inferential target.
What matters is coverage for the main estimands: the Expected Replication Rate (ERR) and the Expected Discovery Rate (EDR). Erik does not mention that the ERR interval appears to perform adequately in this scenario. Thus, the central substantive criticism is narrower: in this particular simulation setting, the EDR confidence interval appears to undercover.
The Response
The specific scenario assumed that all studies had the same power, which implies not only the same sample size, but also the same population effect size. Brunner and Schimmack (2020) already noted that z-curve can have problems in this situation when the true noncentrality parameter falls between two default components. That is exactly Erik’s scenario: mean power is 32%, corresponding to z = 1.5, midway between the default components at z = 1 and z = 2.
Brunner and Schimmack (2020) did not emphasize this problem because most real datasets show substantial heterogeneity in sample sizes and effect sizes (van Erp et al., 2017). Even direct replications of the same paradigm across labs vary in effect size (Klein et al., 2017). Thus, Erik’s critique is based on a known difficult case for z-curve.2.0, but not one that resembles most real applications.Use this instead:
To address this valid concern, z-curve 3.0 was revised to first test for very low heterogeneity. When the data appear unusually homogeneous, the model estimates where a single component would best fit the distribution and then shifts the default grid so that one component is centered near that value. In Erik’s scenario, this places a component near z = 1.5 instead of forcing the fit to choose between z = 1 and z = 2.
The new results are therefore limited to Erik’s specific concern: whether z-curve.2.0 provides adequate coverage for homogeneous data when the true noncentrality parameter falls between two default components.
I validated z-curve 3.0 with the standard simulation code that was used to validate z-curve.2.0 in the Uli simulation design. These simulations across 192 scenarios were validated with just 50 significant results to produce coverage over 95% in most scenarios. To simulate a non-centrality parameter of z = 1.5, I used a standardized mean difference of d = .30 and a sample size of N = 100 (.3 / (2/sqrt(100) = 1.5) . Figure 1 shows the results for 50,000 significant results. Z-curve is able to predict the distribution of the non-significant results based on the model fitted to the significant results well and the estimates of EDR and ERR are accurate and the confidence intervals are tight.
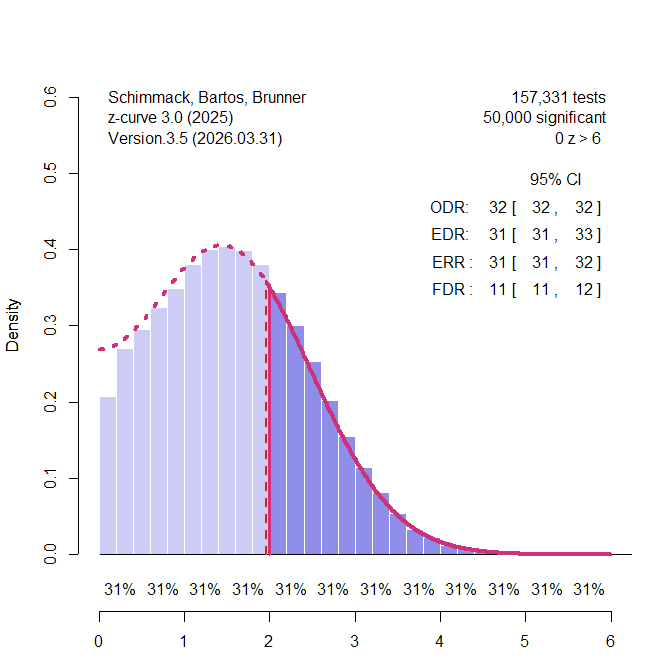
Coverage for the ERR and EDR estimates was tested with k = 50, 500, 5,000, and 50,000. All simulations showed coverage over 95% (Results). In short, z-curve.3.0 now also performs well with homogenous data and can do so quickly with the density method.
In sum, Erik noted that the default method of z-curve.2.0 fails to produce adequate confidence intervals for the EDR estimate in one simulation with homogenous data and a non-centrality parameter between two default components. I responded to this valid criticism by improving z-curve. Z-curve.3.0 now handles homogeneity and heterogeneity in power well and provides credible confidence intervals.
In the comment section Erik writes. “Indeed, as I wrote: “Note that I’m violating the assumption of the z-curve method, but in a way that would be difficult to detect from limited data. That’s the point: You can fix this by changing the default “mu grid”, but you wouldn’t know that.”
As I showed here, this statement is an error. It is very easy to diagnose the problem by estimating the heterogeneity of the data and then adjust the grid according to a preliminary model that is more consistent with the data. The ability of z-curve.3.0 to work in this scenario shows that the problem is fixable. Thus, Erik’s criticism is invalidated by the evidence. Any new evaluations of the z-curve method need to examine the performance of z-curve.3.0.
Thanks for this constructively responsive exchange.