When we talk about the credibility of research findings, three terms often come up: power, discovery rate, and expected discovery rate. They sound related — and they are — but they’re not interchangeable. In fact, using them loosely can create real confusion, especially for students learning statistics or readers trying to understand meta-science.
Let’s unpack what each term means, how they relate, and why it matters to use them precisely.
1. Power: The Conditional Probability of Significance
In classical statistics, power is defined as: Power=P(significant result∣true effect size)\text{Power} = P(\text{significant result} \mid \text{true effect size})
That’s the conditional probability of obtaining a significant result, assuming:
- A specific true effect size (not zero),
- A given sample size, and
- A chosen significance criterion (α).
It’s called “conditional” because it depends on knowing (or assuming) the effect size is real and fixed. Power is typically used before a study to plan how large your sample should be.
Example:
If you believe the true effect size is d = 0.5, and you run 50 participants per group at α = 0.05, your power might be ~0.80. That means 80% of studies with that setup would produce a significant result.
2. Discovery Rate: The Observed Percentage of Significant Results
The discovery rate is simply the proportion of significant results in your observed dataset: Discovery Rate=# of significant resultsTotal # of results\text{Discovery Rate} = \frac{\text{\# of significant results}}{\text{Total \# of results}}
It’s an empirical frequency, not a probability in the theoretical sense.
If you analyze 100 tests and find 40 with p < .05, the observed discovery rate is 40%.
The problem: calling this a “rate” can mislead people into thinking it’s the true long-run probability of significance. It’s not — it’s just what happened in this sample.
3. Expected Discovery Rate (EDR): The Probability of Significance
The expected discovery rate is the long-run probability of obtaining a significant result, averaged over all studies — whether their hypotheses are true or false.
Mathematically: EDR=α⋅P(H0)+Power⋅P(H1)\text{EDR} = \alpha \cdot P(H_0) + \text{Power} \cdot P(H_1)
Where:
- α · P(H₀) is the false positive contribution,
- Power · P(H₁) is the true positive contribution,
- and P(H0)P(H₀) and P(H1)P(H₁) are the proportions of studies with true nulls and true alternatives.
If P(H0)P(H₀) is small (true nulls rare), the EDR is close to the average power. If P(H0)P(H₀) is large, the EDR can be much lower than nominal power.
In meta-science, methods like z-curve use published p-values to estimate the EDR. This gives an estimate of the true long-run proportion of significant results, correcting for selection bias.
4. Why Terminology Matters
- Power is conditional on the effect size being real.
- Discovery rate is observed and may not match the underlying probability.
- Expected discovery rate is unconditional, combining results from both true and false hypotheses, and represents a probability in the population of studies.
Mixing these up can lead to ontological errors — for example, treating an observed rate as if it were a true probability, or interpreting “power” when the null is actually true.
5. Takeaway
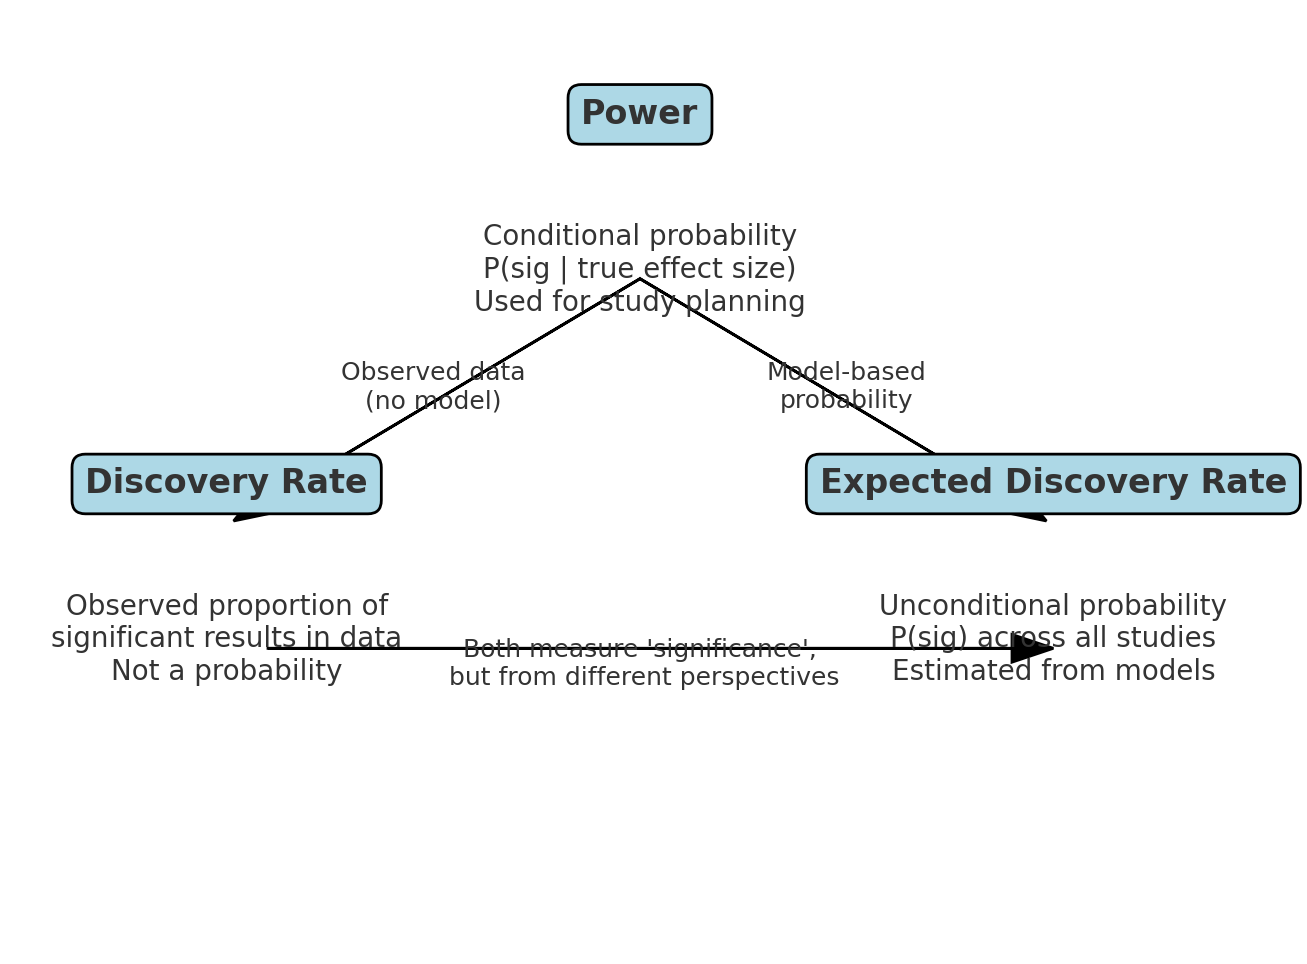
If you’re planning a study → talk about power (conditional probability).
If you’re describing what you found → talk about the discovery rate (observed proportion).
If you’re estimating the underlying probability of significance across studies → talk about the expected discovery rate (model-based probability).
Precise language helps keep the concepts — and the inferences we make from them — clear.