To start on a positive note, Carter et al. (2019) conducted an extensive simulation study that examined the performance of several meta-analytic methods under various scenarios. Most important, the study simulated p-hacking; that is, the use of various statistical tricks to produce significant results in an underpowered study. To my knowledge, this remains the only thorough examination of p-hacking.
The main result in Carter et al.’s simulation study was that p-hacking inflates estimates of traditional methods that assume no selection bias; that is, studies are published independent of the significance of a result. It is well known that this assumption is unrealistic in psychology. To address the problem of selection bias, a number of methods try to correct for selection bias. Carter et al. (2019) observed that these methods tend to produce downward biased estimates when p-hacking is used (they misinterpret the results of p-curve and p-uniform, but that is not relevant here).
One of the methods studied by Carter et al. (2019) is called PET-PEESE. PEESE is only used when PET obtains a positive and significant estimate of the average effect size. Here only PET is relevant because PET produces non-significant or significant and negative results in the reported simulations. PET regresses effect sizes on sampling error. It corrects for bias because studies with larger sampling error require larger effect size estimates to produce a significant result. Thus, p-hacking will inflate the effect size estimates more in these studies and produce a correlation between sampling error and effect size estimates. The regression of effect sizes on sampling error is used to detect bias, and the intercept of the regression model is used as the bias-corrected estimate of the true average population effect size.
Carter et al. (2019) observed that “When PET-PEESE estimates were unbiased or biased downward, as in the case of nonzero true effects, QRPs led to greater downward bias. This downward bias was sometimes quite strong when the null was true. The PET-PEESE method yielded statistically significant effects of opposite sign in many analyses” (p. 134).
So far, so good, but then Carter et al. (2019) make some questionable claims about the performance of PET-PEESE. “A statistically significant PET-PEESE estimate in the unexpected direction probably is incorrect, but researchers should be aware that when they obtain such an estimate, there is likely to be some combination of QRPs and publication bias and, perhaps, a null effect” (p. 134).
The problem in this statement is the suggestion that a negative intercept is likely to occur with a null effect; that is, the population effect size is zero. This suggestion implies that p-hacking would not produce negative effect sizes, when the average population effect size is not zero. This interpretation of PET-PEESE is also implied in other statements, like “the QRPs [questionable research practices = p-hacking] nudged PET-PEESE estimates downward” (p. 124). Nudging suggests a small bias. However, I am going to show that PET-regression can turn a true average effect size of d = .2 into an estimated effect size of d = -.4. This is a large difference that leads to substantially wrong conclusion, even if the d = -4 estimate is interpreted as evidence that d = 0.
I will show that Carter et al.’s (2019) result hold for the specific scenario that they simulated, but that their simulations made unrealistic assumptions about the distribution of sample sizes in psychological research, including the ego-depletion meta-analysis that motivated their simulation study.
Replication of Carter et al. (2019)
I have replicated some important scenarios from Carter et al.’s (2019) extensive design (Schimmack, 2025). In these simulations I focused on a realistic scenario that also applies to Carter et al.’s (2019) meta-analysis of ego-depletion. The known parameters are that the set of studies is about 100 (k = 116) and that there is large heterogeneity in population effect sizes. This assumption was confirmed with the 3PSM selection model that estimated the standard deviation of the population effect sizes to be about .4.
What is not known are the average true effect size and the source of bias; selection bias or p-hacking. Regarding the size of the effect size, the most interesting scenarios are an average effect size of 0 (no effect) or d = .2 (a small effect). Large effects should be detected easily with all methods.
The most important finding of these simulations was that all methods performed well and produced relatively consistent results. The most interesting condition is the simulation of high p-hacking and no selection bias (Carter Simulation #328). A modified selection model produced an estimate of d = .13, 95% = -.13 to .39. While a focus on hypothesis testing would suggest a high false negative rate (i.e., the confidence interval includes 0), the results are clearly consistent with a small effect size and 88% of confidence intervals included the true value of d = .20.
The PET estimate was d = .04, average 95%CI = -.12 to .21 and only 45% of the confidence intervals included the true value of d = .20. This finding is notable for two reasons. First, the selection model performs better than the PET regression. Second, PET does not produce a negative estimate in this scenario.
This is important because Carter et al.’s (2019) meta-analysis of the actual ego-depletion data produced different results. Here the selection model showed evidence of a moderate effect, d = 3, and PET regression produced a negative estimate of d = -.3, a difference of .6 standard deviations. This finding was used by Carter et al. (2019) to argue that (a) the PET results are more credible, (b) the average population effect size in the ego-depletion literature is likely to be zero, and (c) different meta-analytic methods can produce dramatically different results. The problem is that this only occurred in the analysis of the actual ego-depletion data and not in any of the simulation scenarios.
To conclude, Carter et al.’s (2019) extensive simulation study did not produce results that match the results of the ego-depletion literature. We still have to explain how PET can produce significant negative estimates, when the other methods show evidence of a positive average effect.
Problems with PET Regression
While Carter et al. (2019) were the first to examine the influence of p-hacking , other simulation studies had examined the performance of PET regression in previous articles. The author of PET-PEESE published an article with the humble title “Limitations of PET-PEESE,” a rare title in academic journals, especially when it is about an author’s pet theory or model (pun intended) (Stanley, 2017). However, despite the humble title, the article concludes that PET-PEESE works well when the set of studies is reasonably larger (k > 50) and heterogeneity is modest. Even with high heterogeneity, the risk is overestimation. The problem that PET may produce negative estimates even with a small effect size is not discussed. The problem may not gone unnoticed because Stanley (2017) did not examine p-hacking, and Carter et al.’s (2019) simulation study remains the only simulation study that examined effects of p-hacking on PET-regression estimates.
After reproducing Carter et al.’s (2019) simulation and ego-depletion results, I noticed a difference in the sample sizes. The simulation studies included many more studies with large samples than the ego-depletion literature. This led me to examine the influence of sample sizes on p-hacking simulations. Large sample sizes help regression-based models because the meta-analysis will include more studies with unbiased effect size estimates close to the intercept. These estimates will dampen any downward bias that is introduced by p-hacking. However, when these values are rare and the regression line is mostly determined by bias in small studies, the regression model may have a stronger downward bias.
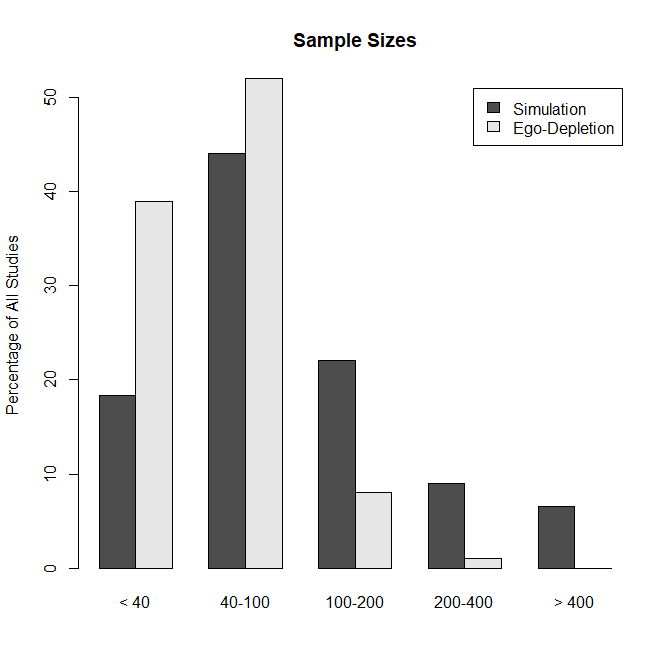
Figure 1 shows the difference in sample sizes between the simulation studies and the actual ego-depletion literature.
Using the simulation sample sizes, I generated 20,000 studies and analyzed them in sets of 4 meta-analysis with 5,000 studies to examine large-sample bias. PET-regression produced effect sizes estimates of d = .00, .02, .06, and .08. Thus, PET underestimates the true average population effect size of d = .20, but it does not produce negative estimates with Carter et al.’s (2019) simulation sample sizes.
I then created a simulation of the ego-depletion effect sizes by sampling from the 20,000 simulations to get a sample of k = 5,000 studies with 39% sample sizes with 20-40 participants, 52% sample sizes between 40 and 100 participants, 8% sample sizes between 100 and 200 participants, and 1% sample sizes between 200 and 400 participants. The PET-regression estimate was d = -.46.
To my knowledge this is the first simulation study that produces a negative average effect size estimate when the true average population effect size is positive. The conditions that produce these estimates are (a) large heterogeneity in population effect sizes, (b) few studies with large sample sizes that produce unbiased estimates of population effect sizes, and (c) p-hacking.
Importantly, Carter et al. (2019) recommend PET-PEESE for this situation that is typical for meta-analyses in psychology. I showed that the use of PET-PEESE in this scenario is only justified when there are sufficient studies with large samples (N > 400) that provide unbiased effect size estimates. However, this is not a realistic assumption for psychology, at least for studies that are not online studies. When sample sizes are modest, PET-regression can produce severely biased estimates that diverge from the results of other studies. Contrary to Carter et al.’s (2019) recommendation, the PET-regression results cannot be trusted in this scenario, and other methods are more likely to produce less biased estimates.
The present results also show a limitation that has been overlooked by Stanley (2017). Stanley noted correctly that “if all studies are small, PET-PEESE has little power to identify a genuine empirical effect. However, this weakness is easily addressed by raising the nominal level to
20% when all studies are highly underpowered” (p. 590). Here I showed that even if studies are relatively large (N = 200) and vary in size, PET-regression can produce severely biased estimates. The problem is not the false positive risk, but rather the false negative risk and even sign reversals. Carter et al. (2019) suggested that negative estimates are probably caused by the lack of a true effect, but I showed that negative estimates can also mask a true positive average effect.
The present result does not imply that ego-depletion is a solid finding. They also do not resolve all of the inconsistencies in the meta-analysis of Carter et al.’s ego-depletion data. For example, the selection model also underestimates the average effect size, d = -.10, in this simulation. Thus, more research is needed to understand how p-hacking influences effect size estimates with different models and how the presence or absence of studies with large sample sizes affects these results. Trying to estimate the true average effect size from a set of p-hacked, underpowered studies may be impossible.
The main implication of this simulation study is that Carter et al.’s (2019) meta-analysis needs to be expanded to examine how p-hacking biases meta-analytic results and how the composition of sample sizes influences these results.