Abstract (summary)
In a previous blog post (Schimmack, 2022), I estimated that affective balance (pleasure vs. pain) accounts for about 50% of the variance in subjective life-evaluations (life-satisfaction judgments). This suggests that respondents also use other information to evaluate their lives, but it is currently unclear what additional information respondents use to make life-satisfaction judgments. In this blog post, I analyzed data from Diener’s Second International Student Survey and found two additional predictors of life-satisfaction judgments, namely a general satisfaction factor (a disposition to report higher levels of satisfaction) and a weighted average of satisfaction with several life domains (financial satisfaction, relationship satisfaction, etc.). This key finding was robust across eight world regions. Another notable finding was that East Asians score much lower and Latin Americans score much higher on the general satisfaction factor than students from other world regions. Future research needs to uncover the causes of individual and cultural variation in general satisfaction.
Introduction
Philosophers have tried to define happiness for thousands of years (Sumner, 1996). These theories of the good life were objective theories that aimed to find universal criteria that make lives good. Despite some influential theories, this enterprise has failed to produce a consensual theory of the good life. One possible explanation for this disappointing outcome is that there is no universal and objective way to evaluate lives, especially in modern, pluralistic societies.
It may not be a coincidence that social scientists in the United States in the 1960s looked for alternative ways to study the good life. Rather than imposing a questionable objective definition of the good life on survey participants, they left it to their participants to define for themselves how their ideal life would look like. The first widely used subjective measure of well-being asked participants to rate their lives on a scale from 0 = worst possible life to 10 = best possible life. This measure is still used and is used in the Gallup World Poll to rank countries in terms of citizens’ average well-being.
Empirical research on subjective well-being might provide some useful information into philosophical attempts to define the good life (Kesebir & Diener, 2008). For example, hedonistic theories of well-being would predict that life-evaluations are largely determined by the amount of pleasure and pain that individuals experiences in their daily lives (Kahneman, 1999). In contrast, eudaimonic theories would receive some support from evidence that individuals’ subjective life-evaluations are based on doing good even if these good deeds do not increase pleasure. Of course, empirical data do not provide a simple answer to difficult and maybe unsolvable philosophical question, but it is equally implausible that a valid theory of well-being is unrelated to people’s evaluations of their lives (Sumner, 1996).
Although philosophers could benefit from empirical data and social scientists could benefit from the conceptual clarity of philosophy, attempts to relate the two are rare (Kesebir & Diener, 2008). This is not the place to examine the reasons for this lack of collaboration. Rather, I want to contribute to this important question by examining the predictors of life-satisfaction judgments. In a previous blog post, I reviewed 60-years of research to examine how much of the variance in subjective life-evaluations is explained by positive affect (PA) and negative affect (NA), the modern terms for the hedonic tone (good vs. bad) of everyday experiences (Schimmack, 2022). After taking measurement error into account, I found a correlation of r = .7 between affective balance (Positive Affect – Negative Affect) and subjective life-evaluations. By conventional standards in the social sciences, this is a strong correlation, suggesting that a good life is a happy life (Kesbir & Diener, 2003). However, a correlation of r = .7 implies that feelings explain only about half of the variance (we have to square .7 to get the amount of explained variance) in life-evaluations. This suggests that there is more to a good life than just feeling good. However, it is unclear what additional aspects of human lives contribute to subjective life-evaluations. To examine this question, I analyzed data from Diener’s Second International Student Survey (see, e.g., Kuppens, Realo, & Diener, 2008). Over 9,000 students from 48 different nations contributed to this study. Subjective life-evaluations were measured with Diener et al.’s (1985) Satisfaction with Life Scale. I only used the first three items because the last two items have lower validity, especially in cross-cultural comparisons (Oishi, 2006). Positive Affect was measured with two items (feeling happy, feeling cheerful). Negative Affect was measured with three items (angry, sad, and worried). The main additional predictors that might explain additional variance in life-satisfaction judgments were 18 questions about domain satisfaction. Domains ranged from satisfaction to self to satisfaction with textbooks. The main empirical question is whether domain satisfaction only predicts life-satisfaction because it increases affective balance. For example, good social relationships may increase PA and decrease NA. In this case, effects of social relationships on life-satisfaction would be explained by higher PA and lower NA, and satisfaction with social relationships would not make a unique prediction to life-satisfaction. However, satisfaction with grades might be different. Students might be satisfied with their lives if they get good grades , even if getting good grades does not increase PA or may even increase NA because studying and working hard is not always pleasurable.
The Structure of Domain Satisfaction
A common observation in studies of domain satisfaction is that satisfaction judgments in one domain tend to be positively correlated with satisfaction judgments in other domains. There are two explanations for this finding. One explanation is that personality factors influence satisfaction (Heller et al., 2004; Payne & Schimmack, 2021; Schneider & Schimmack, 2010). Individuals high in neuroticism or negative affectivity tend to be less satisfied with most life domains, especially those who are prone to depression (rather than anxiety). On the flip side, individuals who are prone to positive illusions tend to be more satisfied, presumably because they have overly positive perceptions of their lives (Schimmack & Kim, 2020). However, another factor that contributes to positive correlations among domain satisfaction ratings are response styles. Two individuals with the same level of satisfaction will use different numbers on the response scale. To separate personality effects and response styles is difficult and requires a measure of response styles or personality. This was not the case in this dataset. Thus, I was only able to identify a factor that reflects a general tendency to provide higher or lower satisfaction ratings without being able to identify the nature of this factor.
A simple way to identify a general satisfaction factor is to fit a bi-factor model to the data. I constrained the unstandardized loadings for all 18 domains to be equal. This model had good fit and only one modification index for financial satisfaction suggested a change to the model. Freeing this parameter showed a weaker loading for financial satisfaction. However, the general satisfaction factor was clearly identified. The remaining variances in the 18 domains still showed a complex pattern of correlations. The pattern of these correlations, however, is not particularly relevant for the present topic because the key question is how much of this remaining variance in domain satisfaction judgments contributes to subjective life-evaluations.
To examine this question, I used a formative measurement model. A formative measurement model is merely a weighted average of domains. The weights are empirically derived to maximize prediction of subjective life-evaluations. Thus, the 18 domain satisfaction judgments are used to create two predictors of subjective life-evaluations. One predictor is a general satisfaction factor that reflects a general tendency to report higher levels of satisfaction. The other predictor is the satisfaction in life domains after removing the influence of the general satisfaction factor.
Predicting Subjective Life-Evaluations
To examine whether the two domain satisfaction predictors add to the prediction of subjective life-evaluations, above and beyond PA and NA, I regressed LS on affective balance, general satisfaction, and domain satisfaction. I allowed for different coefficients across 7 world regions (Northern Europe/Anglo, Southern Europe, Eastern Europe, East Asia, South Asia, Latin America, & Africa). Table 1 shows the results.
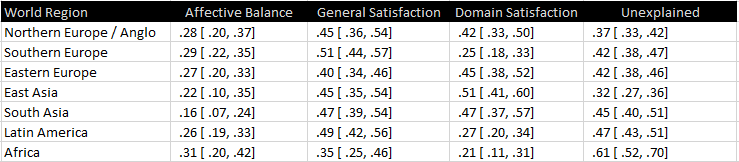
The first finding is that all three predictors explain unique variance in subjective life-evaluations. This shows that the two domain satisfaction factors contribute to life-satisfaction judgments above and beyond affective balance. The second observation is that the general satisfaction factor is a stronger predictor than affective balance and the difference is significant in several regions (i.e., the 95% confidence intervals do not overlap, p < .01). Thus, it is important to study this powerful predictor of subjective life-evaluations in future research. Does it reveal personality effects or is it a mere response style? Finally, the weighted average of domain satisfaction is also a stronger predictor than affective balance except for Africa. This suggests that bottom-up effects of life domains contribute to life-evaluations. An important question for future research is to understand how life domains can be satisfying even if they do not produce high levels of pleasure or low levels of pain. Finally, there is considerable unexplained variance. Thus, future studies need to examine additional predictors of life-satisfaction judgments that produce this variation.

Table 2 shows the relationship of the general satisfaction factor with PA, NA, and affective balance. The key finding is that the general satisfaction factor was positively related to PA, negatively related to NA, and positively related to affective balance. This finding shows that the general satisfaction factor not only predicts unique variance in life-satisfaction judgments, but also predicts variance that is shared with affective balance. Thus, even well-being researchers who focus only on the shared variance between affective balance and life-satisfaction have to take the general satisfaction factor into account. The general satisfaction factor also contributes to the correlation between PA and NA. For example, for Anglo nations, the correlations of r = .50 with PA and r = -.55 imply a negative correlation of r = -.28 between PA and NA. An important question is how much of this relationship reflects real personality effects versus simple response styles.

Table 3 shows the results for the weighted average of domain satisfaction after removing the variance due to the general satisfaction factor. The pattern is similar, but the effect sizes are weaker, indicating that the general factor is more strongly related to affective balance than specific life domains.
In conclusion, domain satisfaction judgments can be divided into two components. One component represents a general disposition to provide higher satisfaction ratings. The other component represents satisfaction with specific life domains. Both components predict affective balance. In addition, both components predict subjective life-evaluations above and beyond affective balance. However, there remains substantial unexplained variance in life-satisfaction judgments that is unrelated to affective balance and satisfaction with life domains.
The contribution of Life Domains to the Weighted Average of Domain Satisfaction
Table 4 shows the domains that made a statistically significant contribution to the prediction of subjective life evaluations.

Strong effects (r > .3) are highlighted in green, whereas non-significant results are highlighted in red. The first observation is that subjective life-evaluations are influenced by many life domains with a small influence rather than a few life domains with a strong influence. This finding suggests that subjective life-evaluations do take a general picture rather than being influenced by a few, easily accessible life domains. The only exception was Africa where only two domains dominated the prediction of subjective life-evaluations. Whether this is a true cultural differences or a method problem remains to be examined in future research.
The second observation is that financial satisfaction and satisfaction with social relationships were the strongest and most consistent predictors of life-satisfaction judgments across world regions. These effects are consistent with evidence that changes in social relationships or income predict changes in life-satisfaction judgments (Diener, Lucas, & Scollon, 2006).
It is also important to remember that the difference between a statistically significant and a non-significant result is not itself statistically significant. Many of the confidence intervals are wide and overlap. Overall, the results suggest more similarity than differences across students from different world regions. Future research needs to examine whether some of the cultural differences are replicable. For example, academic abilities seem to be more important in both East and South Asia than in Latin America.
Regional Differences in Predictors of Subjective Well-Being
Table 5 shows the differences between world regions in the components that contribute to subjective life-evaluations. In this table values for global satisfaction are means, whereas the other values are intercepts that remove the influence of global satisfaction differences and domain specific differences for PA and NA and the influence of all predictors for life-satisfaction.

Red highlights show differences that imply lower well-being in comparison to the reference region Northern Europe/Anglo. The results are consistent with overall lower well-being in the other regions which is consistent with national representative surveys by Gallup.
Probably the most interesting finding is that East Asia has a very large negative difference for the global satisfaction factor. The complementary finding is Latin America’s high score on the general satisfaction factor. These finding are consistent with evidence that East Asia has lower well-being and Latin American nations have higher well-being than objective indicators of well-being like income predict. Thus, general satisfaction is likely to be a unique predictor of well-being above and beyond income and objective living conditions. The important question is whether this is merely a method artifact, as some have argued, or whether it is a real personality differences between cultures.