Over 40-years ago, Costa and McCrae (1980) proposed that subjective well-being is influenced by two personality traits, namely extraversion and neuroticism. They even presented their theory in the form of a causal model.

Forty years later, this model still dominates personality theories of subjective well-being (Anglim et al., 2020). The main revision has been the addition of agreeableness and conscientiousness as additional personality factors that influence well-being (Heller et al., 2004; McCrae & Costa, 1991).
Although it seems natural to test the proposed causal model using structural equation modeling (SEM), personality researchers have resisted the use of causal modeling as a statistical tool. One reason has been that SEM models often do not fit personality data (McCrae et al., 1996). This is hardly a convincing reason to avoid using SEM in personality research. Astronomers did not ban new telescopes that showed more moons around Jupiter than Galileo discovered. They simply revised the number of moons.
It is therefore urgently needed to test Costa and McCrae’s theory with a method that can falsify the theory. Even if the data do not fit Costa and McCrae’s original theory, it does not take away from their important contribution 40 years ago. Nobody is arguing that Galileo was a bad astronomer because he only discovered four moons.
Structural equation modeling has two benefits for theory development. First, it can be used to test causal theories. For example, the model in Figure 1 predicts that effects of extraversion on life-satisfaction is mediated by positive affect, whereas the effect of neuroticism is mediated by negative affect. Finding additional mediators would falsify the model and lead to the revision of the theory. The second benefit is that SEM makes it possible to fit measurement models to the data. This is the aim of the present blog post.
Measurement of Personality
In the 1980s, personality psychologists developed the Big Five model as a general framework to describe individual differences in personality traits. This unified framework has led to the development of Big Five questionnaires. The development of relatively short questionnaire enabled researchers to include personality measures in studies that had a different research focus. As a result, many studies reported correlations between Big Five measures and life-satisfaction. These correlations have been meta-analyzed in several meta-analysis. The results were summarized by Anglim et al. (2020), who conducted the latest meta-analysis (current (core)).

Assuming that the latest meta-analysis provides the best estimate of the average correlations, neuroticism shows the strongest relationship with r = -.4, followed by extraversion and conscientiousness, r = .3, and agreeableness, r = .2. The correlation with openness is consistently the weakest, r = .1.
The main problem with these correlations is that they cannot be interpreted as effect sizes of the individual personality traits on life-satisfaction, even if we are willing to assume a causal relationship between personality traits and life-satisfaction. The reason is that that scores on the Big Five scales are not independent. As a result, the unique relationship between one Big Five scale and life-satisfaction ratings is smaller (Kim et al., 2018).
It also matters what causes correlations among Big Five scales? While some theories postulate that these correlations reflect common personality factors, evidence suggests that most of the correlations reflect two response styles, evaluative bias (halo) and acquiescence bias (Anusic et al., 2009). Evaluative bias is particularly problematic because it also influences life-satisfaction ratings (Kim et al., 2012; Schimmack, Schupp, & Wagner, 2008). This shared method variance inflates correlations between personality ratings and life-satisfaction ratings. Thus, the simple correlations in meta-analysis provide inflated effect size estimates. However, it is unclear how much halo bias contributes to variation in life-satisfaction ratings and how much the Big Five contribute to well-being when halo variance is statistically controlled. To answer this question, I conducted a new meta-analysis.
I started with Anglim et al.’s (2020) list of studies to search for reasonably large datasets (N > 700) that reported correlations among all Big Five scales and a life-satisfaction measure. I then added additional datasets that I knew that were not included in the meta-analysis. The focus on large datasets was motivated by two considerations. First, studies with small N may not meet the requirements for structural equation modeling and are likely to produce unreliable estimates. Second, large samples are weighted more heavily in meta-analyses. Thus, small datasets will often only increase sampling error without altering the actual results. To ensure that the selection of studies did not influence the results, I compared the simple correlations to the results reported by Anglim et al. (2020).
I included 32 datasets in the analysis with a total sample size of N = 154,223. The correlations tended to be a little bit weaker, but the differences are rather small.

Measurement Models
Typical studies that correlate Big Five scales with life-satisfaction ratings do not have a formal measurement model. Personality is operationalized in terms of the sum score (or mean) on several personality items. This “measurement model” is illustrated in Figure 1. To simplify the presentation, the model includes only two items per Big Five dimension, but the model can be generalized to longer scales.
The key part of this model are the arrows from items (n1 … c2) to scale scores (N … C). The correlations among scale scores are determined by the inter-item correlations. The scale scores are then correlated with the life-satisfaction scores.
In this model the assignment of items to scales is arbitrary, but Big Five scales are not. They are based on a theory that scale scores reflect factors that produce a systematic pattern of correlations. The simple assumption is that items were selected to reflect a particular trait (e.g., n1 & n2 reflect the factor Neuroticism). This assumption is illustrated in Figure 2.

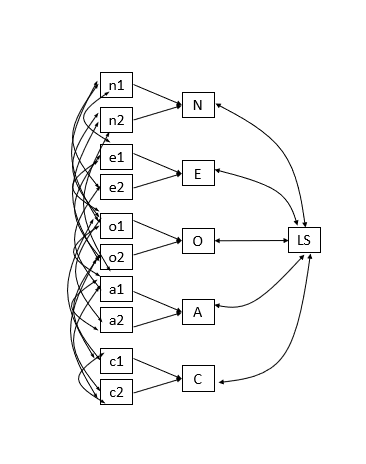
In Figure 2, the squares with capital letters in italics (N, E, O, A, C) represent factors. Factors are unobserved variables that cause variation in items. In contrast, the squares with capital letters represent observed variables that are created by averaging observed scores on items. Figure 2 is a measurement model because it makes predictions about the covariation among the items. The causal arrows from the factors to items imply that two items of the same factor are correlated because they are influenced by a common factor (e.g., n1 & n2 are correlated because they are influenced by neuroticism). The simple model in Figure 2 implies that the correlations between items of different factors are zero. It is well-known that this simple measurement model does not fit actual data because there are non-zero correlations between items from different factors. However, this lack of fit is often ignored when researchers simply use scale scale scores (N to C) as if they have perfect indicators of factors (N to C). With structural equation modeling it is possible to fit measurement models that actually fit the data and examine how the Big Five factors are related to life-satisfaction scores. This is what I did for each of the 32 datasets. The basic measurement model is shown in Figure 3.

The model in Figure 3 represents the covariation among Big Five items as the function of the Big Five factors (N = Neuroticism/Negative Emotionality, E = Extraversion, O = Openness, A = Agreeableness, & C = Conscientiousness) and a sixth factor H = Halo. The halo factor produces evaluatively consistent correlations among all items. Typically positively coded items of extraversion, openness, agreeableness, and conscientiousness and reverse coded items of neuroticism have positive loadings on this factor because these items tend to be more desirable. However, the loading depends on the desirability of each item. The model no longer contains sum scores (N, E, O, A, C). The reason is that sum scores are suboptimal predictors of a particular criterion. This model maximizes the variance predicted in life-satisfaction scores. However, the model can distinguish between variance that is explained by the six factors and variance that is explained by residual variance in specific items. Using the model indirect function, we get standardized estimates of the contribution of the six factors to the life-satisfaction scores.
Average Effect Sizes
Figure 4 shows the standardized effect sizes. All effect sizes are smaller than the meta-analytic correlations. Neuroticism remains the strongest Big Five predictor, b = .25, but halo is an equally strong predictor, b = .26. Consistent with Costa and McCrae’s model, extraversion is a significant predictor, but the effect size is small, b = .14. Consistent with McCrae and Costa (1991), agreeableness and conscientiousness are additional predictors, but the effect sizes are even smaller, agreeableness b = .04 and conscientiousness b = .09. Together, the Big Five factors explain 10% of the variance in life-satisfaction and halo explains an additional 6%.

The following figures show the results for each Big Five factor in more detail. Neuroticism effect sizes show a normal distribution. The 95%CI based on tau ranges from b = .09 to b = .44. This variability is not sampling error, which is much smaller in these large samples. Rather it reflects heterogeneity in effect sizes due to differences in populations, types of measurement, and a host of other factors that vary across studies. Thus, it is possible to conclude that neuroticism explains between 1% and 19% of the variance in well-being. This is a wide confidence interval and future research is needed to obtain more precise estimates and to find moderators of this relationship.The figure also shows that the mean effect size for representative samples is a bit smaller than the one for the average sample. As the average is based on an arbitrary sample of studies, the average for representative samples may be considered a better estimate of the typical effect size, b = .20. Based on this finding, neuroticism may explain only 4% of the variance in life-satisfaction ratings.

Extraversion is also a significant predictor, with a point estimate of b = .14 for all samples and b = .08 for representative samples, suggesting that extraversion explains about 1 to 2 percent of the variance in life-satisfaction judgments. The 95%CI ranges from b = .01 to b = .27, which corresponds to an estimate of 8% explained variance. This confirms the widely held assumption that extraverts are happier than introverts, but the effect size is smaller than some reviews of the literature suggest.

The results for openness are very clear. Openness has no direct relationship with life-satisfaction. The point estimate is close to zero and the 95%CI ranges from b = -.08 to b = .05. Thus, there is insufficient heterogeneity to make it worthwhile to examine moderators. Of course, the relationship is unlikely to be exactly zero, but very small effect sizes are impossible to study reliably given the current levels of measurement error in personality measures.

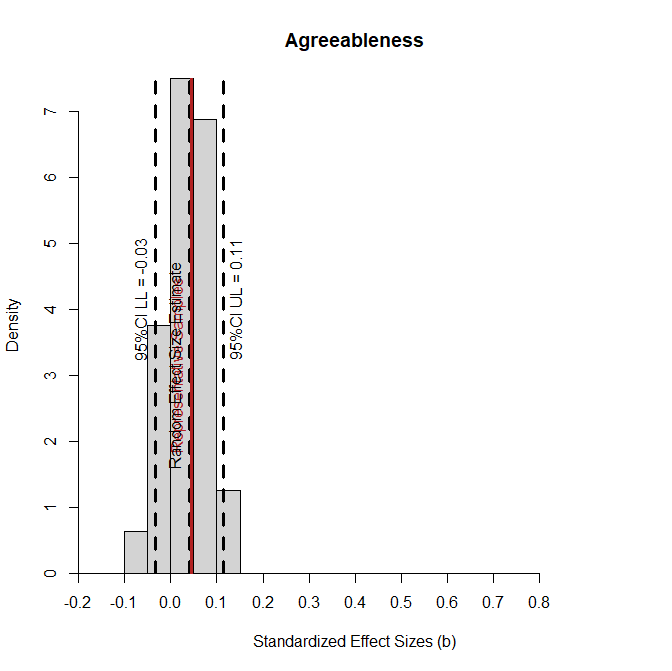
McCrae and Costa (1991) provided some evidence that agreeableness and conscientiousness also predict life-satisfaction. Meta-analyses supported this conclusion, but effect size estimates were inflated by shared method variance. The following results show that the contribution of these two personality factors to life-satisfaction is small.
The point estimate for agreeableness is b = .04 for all samples and b = .05 for representative samples. The 95%CI ranges from b = .03 to b = .11. Thus, the upper limit of the confidence interval corresponds to an estimate that agreeableness explains only 1% of the variance in life-satisfaction judgments. This is a small effect size. This finding has theoretical implications for theories that try to link pro-social traits like empathy or gratitude to life-satisfaction. The present results suggest that another way to achieve well-being is to focus on one’s own well-being. Of course, selfish pursuits of happiness may have other negative consequences that make pro-social pursuits of happiness more desirable, but the present results do not suggest that a prosocial orientation in itself ensures higher levels of life-satisfaction to any substantial degree. In short, assholes can be happy assholes.
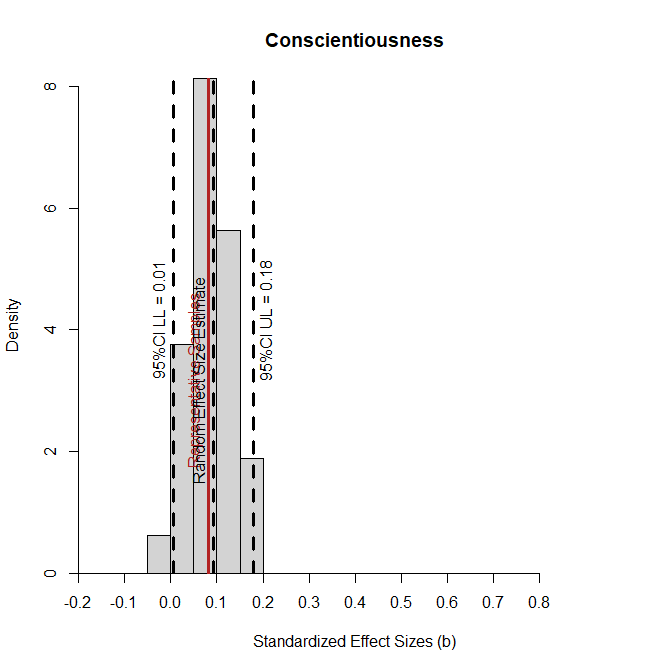
The effect size for conscientiousness is a bit stronger, with a point estimate of b = .09 for all samples and b = .08 for representative samples. The 95%CI is relatively wide and ranges from b = .01 to b = .18, which covers a range of effect sizes that could be considered too small to matter to effect sizes that are substantial with up to 3% explained variance. Thus, future research needs to explore moderators of this relationship.
The most overlooked predictor of life-satisfaction judgments is the shared variance among Big Five ratings that can be attributed to evaluative or halo bias. This factor has been studied separately in a large literature on positive illusions and self-enhancement. The present meta-analysis shows point estimates for the halo factor that match those for neuroticism with b = .26 for all samples and b = .22 for representative samples. The 95^CI ranges from b = .12 to b = .4, which means the effect size is in the small to moderate range. The biggest question is how this finding should be interpreted. One interpretation is that positive illusions contribute to higher life-satisfaction (Dufner et al., 2019; Taylor & Brown, 1988). The alternative interpretation is that halo variance merely reflects shared method variance that produces a spurious correlation between self-ratings of personality and life-satisfaction (Schimmack, Schupp, & Wagner, 2008; Schimmack & Kim, 2020). Only multi-method studies that measure well-being with methods other than self-ratings can answer this question, but the present meta-analysis shows that up to 16% of the variance in self-ratings can be attributed to halo bias. Past studies often failed to distinguish between Big Five factors and the halo factor, leading to inflated effect sizes estimates for neuroticism, extraversion, and conscientiousness. Future studies need to control for evaluative biases in studies that correlate self-ratings of personality with self-ratings of outcome measures.

In conclusion, the results do confirm Costa and McCrae’s (1980) prediction that neuroticism and extraversion contribute to life-satisfaction. In addition, they confirm McCrae and Costa’s (1991) prediction that conscientiousness is also a positive predictor of life-satisfaction. While the effect for agreeableness is statistically significant, the effect size is too small to be theoretically meaningful. In addition to the predicted effects, evaluative bias in personality ratings contributes to life-satisfaction judgments and the effect is as strong as the effect of neuroticism.
Moderator Analysis
I used the metafor r-package to conduct moderator analyses. Potential moderators were type of measure (NEO vs. other, BFI vs. other), number of personality items per factor, number of life-satisfaction items (one item vs. scale), the type of data (correlation matrix vs. raw data), and culture (anglo vs. other). I ran the analysis for each of the six factors. With 7 moderators and 6 variables, there were 42 statistical tests. Thus, chance alone is expected to produce two significant result with alpha = .05, but no significant result with alpha = .01. I therefore used alpha = .01 to discuss moderator results.
There were no significant moderators for neuroticism. For extraversion, number of personality items was a significant predictor, p < .001. However, the effect size is weak and suggested that the correlation would increase from .12 for 2 items to .15 for 10 items. For openness, a significant culture effect emerged, p = .015 . Openness had a small negative effect in Anglo cultures, b = -.04, and no effect in non-Anglo cultures, b = .01. However, the effect size is too small to be meaningful. There were no significant results for agreeableness. For conscientiousness, an effect of questionnaire was significant, p = .008. The NEO showed somewhat smaller effects, but this effect was no longer significant in a univariate analysis, and the effect size was small, NEO b = .06 vs. other b = .10. For halo, a significant effect of the number of life-satisfaction items emerged, p = .005. The effect was stronger in studies with multiple-item measures of life-satisfaction, b = .20 vs. b = .28. The reason could be that aggregation of life-satisfaction items increases reliable variance, including response styles. In sum, the moderator analysis suggests that results are fairly robust across studies with different measures and across different Western cultures.
Discussion
Quantifying effect sizes is necessary to build quantitative theories of personality and well-being. The present results show that three of the Big Five traits are reliable predictors of life-satisfaction ratings that jointly explain a substantial amount of variance in life-satisfaction ratings. Neuroticism is the strongest predictor, but the amount of explained variance is unclear. The 95^CI ranges from 1% to 19%, with a point estimate of 7%. Extraversion is the second strongest predictor with a 95%CI ranging from 0 to 8% of explained variance with a point estimate of 2% explained variance. The 95%CI for conscientiousness also ranges from 0 to 3% of variance with a point estimate of 1%. Combined these results suggest that the Big Five personality traits explain between 1% and 20% of the variance in life-satisfaction with a point estimate of 10% explained variance. Worded differently, the Big Five traits explain 10 +/- 10% of the variance in life-satisfaction judgments. Another 7 +/- 6 percent of the variance is explained by halo bias. Subsequently, I discuss the various implications of these findings for future research on personality and well-being.
Improvement in Measurement
Future research needs to improve the construct validity of Big Five measures. Existing measures are ad-hoc scales that lack a clear theoretical foundation with no clear rational for the selection of items. New measures like the Big Five Inventory 2 are an improvement, but effect size estimates with this measure that control for halo variance are lacking. Even the BFI-2 has limitations. It measures the higher-order Big Five factors with three facet measures, but more facet measures would be better to obtain stable estimates of the factor loadings of facets on the Big Five factors.
Longitudinal Evidence
The Big Five personality factors and their facets are conceptualized as stable personality dispositions. In support of this view, longitudinal studies show that the majority of the variance in Big Five measures is stable (Anusic & Schimmack, 2016). There is also evidence that up to 50% of the variance in well-being measures is stable (Anusic & Schimmack, 2016), but that there is more state variance in well-being that changes in response to life circumstances (Schimmack & Lucas, 2010). Taken together, these results suggest that personality traits account for a larger portion of the stable variance in well-being. Future studies need to test this prediction with longitudinal studies of personality and well-being.
Mediating Processes
Most of the research on personality and well-being has been limited to correlational studies. Therefore theories that explain how personality traits influence well-being are rare. One theory postulates that extraversion and neuroticism are affective dispositions that produce individual differences in affect independent of situational factors (mood), and mood colors life-evaluations (Schimmack, Diener, & Oishi, 2002). Alternative theories suggests that personality traits influence actual life-circumstances or interact with environmental factors to produce individual differences in well-being. To test these theories, it is important to include measures of environmental factors in studies of personality and well-being. Moreover, sample sizes have to be large to detect interaction effects.
Halo and Well-Being
The presence of halo variance in personality ratings has been known for over 100 years (Thorndike, 1920). Over the years, this variance has been attributed to mere response styles or considered evidence of a motivation to boost self-esteem. There have been few attempts to test empirically whether halo variance is merely a rating bias (other deception) or reflects positive illusions about the self. This makes it difficult to interpret the contribution of halo variance to variance in self-ratings of well-being. Does this finding merely show shared method variance among self-ratings or do positive illusions about the self increase positive affect, life-satisfaction, and well-being . Studies with informant ratings of well-being are rare, but tend to show no relationship between halo bias and informant ratings of well-being (Kim, Schimmack, & Oishi, 2012; Schimmack & Kim, 2020). This suggests that halo variance is merely rating bias, but it remains possible that positive illusions increase well-being in ways that are not reflected in informant ratings of well-being.
Normative Theories of Personality Change
Some personality psychologists have proposed a normative theory of personality. Accordingly, the end goal of personality development is to become low in neuroticism and high in agreeableness and conscientiousness. This personality type is considered more mature. However, a justification for this normative model of personality is lacking. The main objective justification for normative theories of personality is optimal functioning because functions have clear and external standards of evaluations. For example, within the context of work psychology, conscientiousness can be evaluated positively because highly conscientious workers are more productive. However, there are no objective criteria to evaluate people’s lives. Thus, the only justification for normative theories of personality would be evidence that some personality traits make it more difficult for individuals to achieve high well-being. The present results suggest that neuroticism is the key personality trait that impedes well-being. However, the results do not support the notion that high agreeableness or high conscientiousness are normatively better than low agreeableness or low conscientiousness because these traits can vary without notable effects on well-being.
Conclusion
Correlations between personality and well-being measures have been reported since Hartmann’s (1936) seminal study of neuroticism and well-being. The literature has grown and it has been meta-analyzed repeatedly. The results consistently show that neuroticism is the strongest predictor of life-satisfaction ratings, but that extraversion, agreeableness, and conscientiousness also show notable simple correlations with life-satisfaction. The present meta-analysis went beyond simple correlations and separated content variance from evaluative variance (halo) in self-ratings of personality. The results showed that halo predicts substantive variance in well-being and accounts for most of the correlations of agreeableness and conscientiousness with well-being. Future studies of personality and well-being need to separate substantive and evaluative variance to take the evaluative nature of personality ratings into account.