When it became possible to measure genetic variation using molecular biological methods, psychologists started to correlated genetic variation in a single gene with phenotypes. After one decade of research it became apparent that few of these results replicated because the effects of a single gene on complex human traits are at best very small and would require astronomically large sample sizes to produce replicable results. Many psychologists today think that this decade of research with thousands of findings served mainly as an example of the problems of exploratory research with small samples and small effect sizes that uses the classic significance threshold of alpha = .05 to reject the null-hypothesis.
For meta-scientists, the articles that published these results provide an opportunity to test meta-statistical methods. Here I examine research on one of the most widely used genetic variations, namely the serotonin (5-HT) transporter gene (5-HTTLPR) to predict individual differences in personality traits or gene x situation interactions.
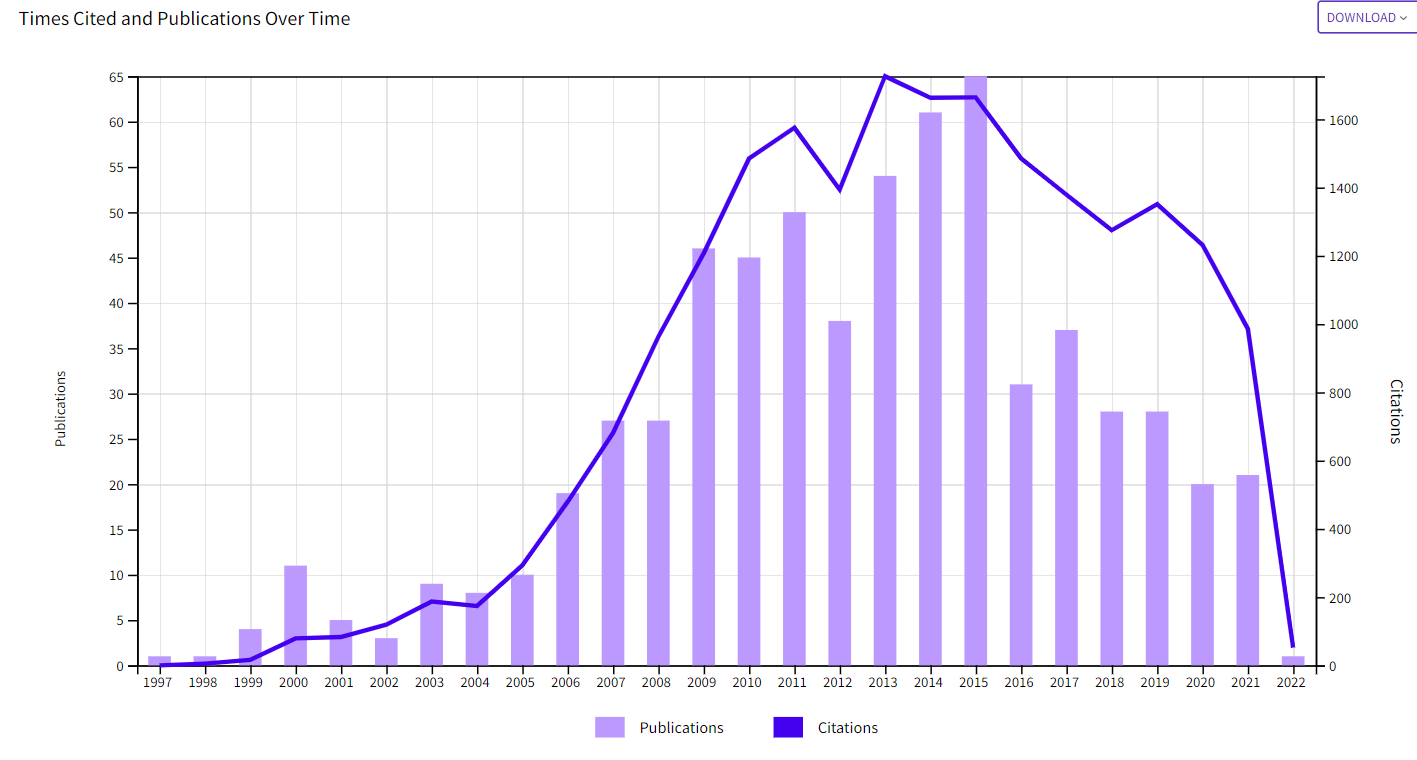
I used Web of Science to find articles with “5-HTTLPR” in the title. I found 650 articles. The citation report for these 650 articles shows an unusual decrease in citations, indicating that many researches no longer believe in these results. It also shows that publications are decreasing.
I then searched a database of articles from 121 journals for matching articles (Schimmack, 2022) and identified 181 articles. I then used an R-program to search for statistical tests results reported in these articles. One limitation of this method that results are not limited to statistical tests that include the serotonin transporter gene variation. However, chances are that this makes the results conservative because genetic effects are likely to be smaller than other effects examined in this articles.
The search produced 1,262 tests statistics (see Figure 1).
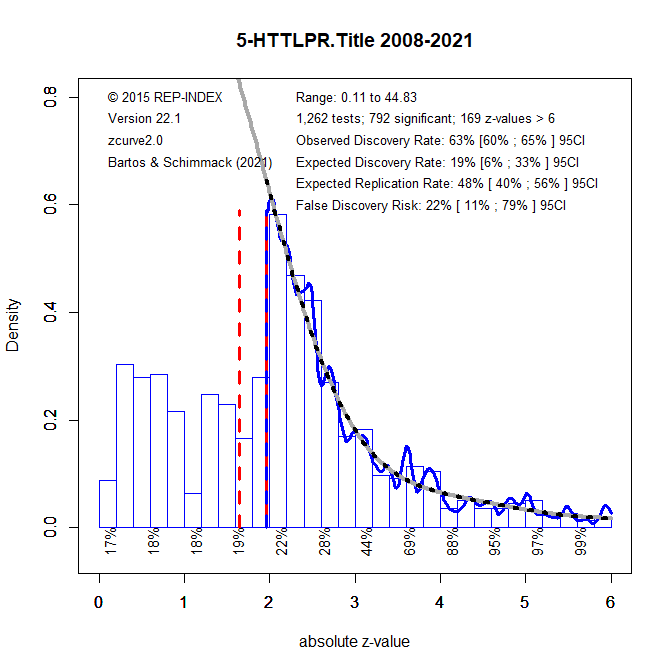
All test statistics are converted into absolute z-scores as a common metric that shows how strong the evidence against the null-hypothesis is. The histogram shows a peak (mode) at p = .05 (z = 1.96) with a steep drop for results with p-values greater than .05 (z < 1.96). This shows that results are selected for significance. Based on a statistical model (Bartos & Schimmack, 2021; Brunner & Schimmack, 2020) of the distribution of statistically significant results (z > 1.96), the model estimates a discovery rate of 19%. This means that researchers have only a 19% chance to obtain a significant result. However, due to selection for significance articles show 63% significant results. Thus, the observed discovery rate is three times higher than the expected discovery rate. This implies that reported effect sizes are at least double if not three times larger than actual effect sizes.
The expected discovery rate of 19% can also be used to estimate the false discovery risk (Soric, 1989) because false discoveries become more likely as the number of discoveries decreases. With an expected discovery rate of 19%, the false discovery risk is 22%. However, due to sampling error this estimate may be an underestimation and the upper limit of the 95% confidence interval allows for 79% false positive results.
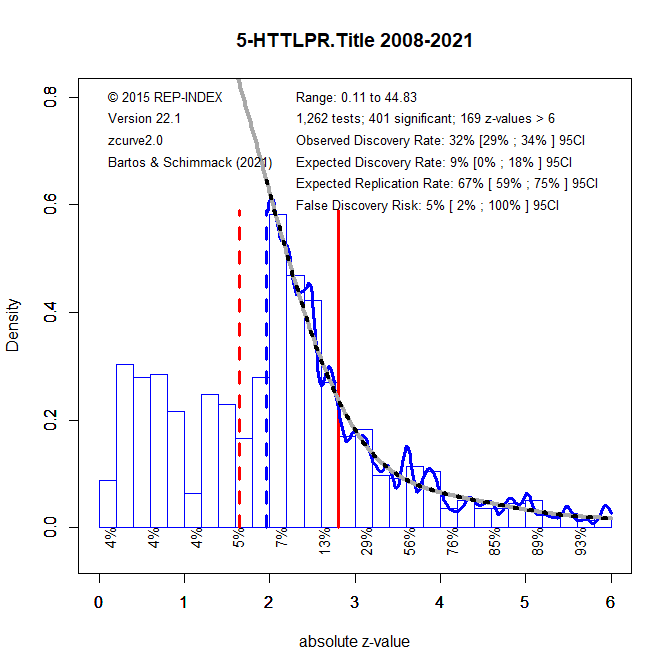
One solution to this problem is to lower the criterion for statistical significance, which is what modern molecular genetics studies are doing today to keep the false discovery risk at an acceptable level. Setting alpha to .005 reduces the false discovery risk to 5%, but the confidence interval increases and the upper limit is 100%. Moreover, there percentage of significant results with alpha = .05 (63%) is cut in half with the new alpha of .005 (32%).
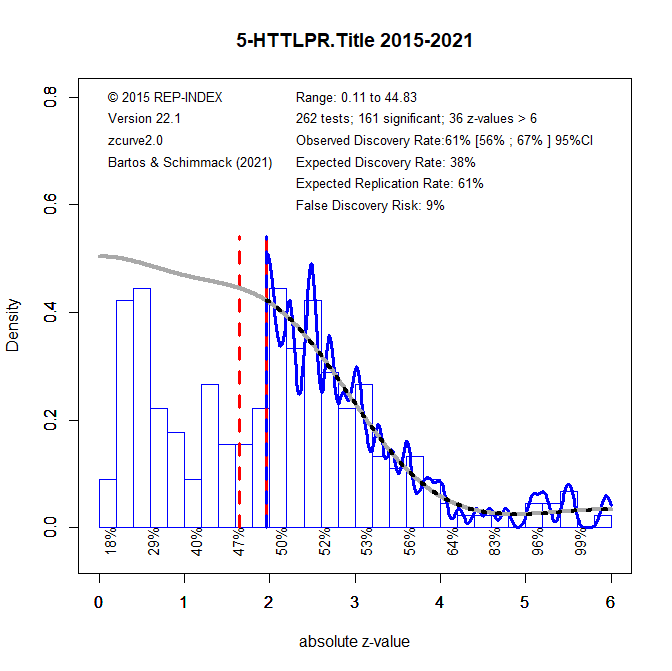
The next figure shows that most of the significant results are from articles published before 2015. After 215, only 262 test results were found. These results are more credible with an EDR of 38%, but there is still evidence of selection for significance, ODR = 61%.
In conclusion, researchers often get carried away with new methods that produce novel findings. In these exploratory studies, it is problematic to use alpha = .05 as a standard criterion for statistical significance. Honest reporting of results would reveal that the actual discovery rate is low and alpha = .05 produces too many false positive results. In the absence of clear scientific norms that do not allow researchers to cherry-pick their published results, z-curve analysis can be used to detect low discovery rates and to recommend appropriate alpha levels.
1 thought on “The 5-HTTLPR Debacle”