Abstract
It has been proposed that psychologists used a number of p-hacking methods to produce false positive results. In this post, I examine the prevalence of two p-hacking methods, namely the use of covariates and peaking until a significant result is obtained. The evidence suggests that these strategies are not very prevalent. One explanation for this is that they are less efficient than other p-hacking methods. File-drawering of small studies and inclusion of multiple dependent measures are more likely to be the main questionable practices that inflate effect sizes and success rates in psychology.
Article
P-hacking refers to statistical practices that inflate effect size estimates and increase the probability of false positive results (Simonsohn et al., 2014). There are a number of questionable practices that can be used to achieve this goal. Three major practices are (a) continuing to add participants until significance is reached, (b) adding covariates, and (c) testing multiple dependent variables.
In a previous blog-post, I pointed out that two of these practices are rather dumb because they require more resources than simply running many studies with small samples and to put non-significant results in the file drawer (Schimmack, 2021). The dumbest p-hacking method is to continue data collection until significance is reached. Even with sampling until N = 200, the majority of studies remain non-significant. The predicted pattern is a continuous decline in the frequencies with increasing sample sizes. The second dumb strategy is to measure additional variables and to use them as covariates. It is smarter to add additional variables as dependent variables.
Simonsohn et al. (2014) suggested that it is possible to detect the use of dumb p-hacking methods by means of p-curve plots. Repeated sampling and the use of covariates produce markedly left-skewed (monotonic decreasing) p-curves. Schimmack (2021) noted that left-skewed p-curves are actually very rare. Figure 1 shows the p-curve for the most cited articles of 71 social psychologists (k = 2,570). The p-curve is clearly right-skewed.

I then examined p-curves for individual social psychologists (k ~ 30). The worst p-curve was flat, but not left-skewed.

The most plausible explanation for this finding is that no social psychologists tested only false hypotheses. As studies with true effect sizes produce right skew, p-hacking cannot be detected by left-skewed p-curves.
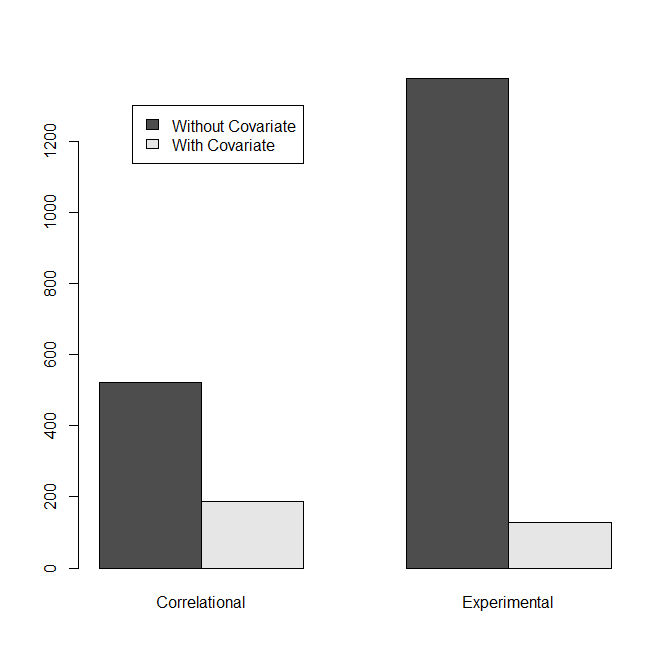
I therefore examined the use of dumb p-hacking strategies in other ways. The use of covariates is easy to detect by coding studies whether they used covariates or not. If researchers use multiple covariates the chances that a result becomes significant with a covariate are higher than the chances to get the significant result without a covariate. Thus, we should see more results with covariates and the frequency of studies with covariates provides some information about the prevalence of covariate hacking. I also distinguished between strictly experimental studies and correlational studies because covariates are more likely to be used in correlational studies for valid reasons. Figure 3 shows that the use of covariates in experimental studies is fairly rare (8.6%). If researchers would try only one covariate, this would limit the number of studies that were p-hacked with covariates to 17.2%, but the true frequency is likely to be much lower because p-hacking with a single covariate barely increases the chances of a significant result.
To examine the use of peaking, I first plotted the histogram of sample sizes. I limited sample sizes to studies with N < 200 to make the distribution of small sample sizes more visible.

There is no evidence that researchers start with very small sample sizes (n = 5) and publish as soon as they get significance (simulation by Simonsohn et al., 2014). This would have produced a high frequency of studies with N = 10. The peak around N = 40 suggests that many researchers use n = 20 as a rule of thumb for the allocation of participants to cells in two-group designs. Another bump around N = 80 is explained by the same rule for 2 x 2 designs that are popular among social psychologists. N = 100 seems to be another rule of thumb. Except for these peaks, the distribution does show a decreasing trend suggesting that peaking was used. However, there is also no evidence that researchers simply stop after n = 15 when results are not significant (Simonsohn et al., 2014, simulation).
If the decreasing trend is due to peaking, sample sizes would be uncorrelated with the strength of the evidence. Otherwise, studies with larger samples have less sampling error and stronger evidence against the null-hypothesis. To test this prediction, I regressed p-values transformed into z-scores onto sampling error (1 / sqrt(N). I included the use of covariates and the nature of the study (experimental vs. correlational) as additional predictors.
The strength of evidence increased with decreasing sampling error without, z = 3.73, and with covariates, z = 3.30. These results suggest that many studies tested a true effect because a true effect is necessary to increase the strength of evidence against the null-hypothesis. To conclude, peaking may have been used, but not at excessive levels that would produce many low z-scores with large samples.
The last analysis was used to examine whether social psychologists have used questionable research practices. The difference between p-hacking and questionable research practices is that p-hacking excludes publication bias (not reporting entire studies). The focus on questionable research practices has the advantage that it is no longer necessary to distinguish between selective reporting of analyses or entire studies. Most researchers are likely to use both p-hacking and publication bias and both practices inflate effect sizes and lower replicability. Thus, it is not important to distinguish between p-hacking and publication bias.

The results show clear evidence that social psychologists used questionable research practices to produce an abundance of significant results. Even not counting marginally significant results, the success rate is 89%, but the actual power to produce these significant results is estimated to be just 26%. This shows that a right-skewed does not tell us how much questionable research practices contributed to significant results. A low discovery rate of 26% translates into a maximum false discovery rate of 15%. This would suggest that one reason for the lack of left-skewed p-curves is that p-hacking of true null-hypothesis is fairly rare. A bigger problem is that p-hacking of real effects in small samples produces vastly inflated effect size estimates. However, the 95% confidence interval around this estimate reaches all the way to 47%. Thus, it cannot be ruled out that a substantial number of results was obtained with true null-hypotheses by using p-hacking methods that do not produce a marked left-skew and publication bias.