The article “False-Positive Psychology: Undisclosed Flexibility in Data Collection and Analysis Allows Presenting Anything as Significant”, henceforth the FPP article, is now a classic in the meta-psychological literature that emerged in the wake of the replication crisis in psychology.
The the main claim of the FPP article is that it is easy to produce false positive results when researchers p-hack their data. P-hacking is a term coined by the FPP authors for the use of questionable research practices (QRPs, John et al., 2012). There are many QRPs, but they all have in common that researchers conduct more statistical analysis than they report and selectively report only the results of those analyses that produce a statistically significant result.
The main distinction between p-hacking and QRPs is that p-hacking ignores some QRPs. John et al. (2012) also include fraud as a QRP, but I prefer to treat the fabrication of data as a distinct form of malpractice that clearly requires intent to deceive others. The main difference between p-hacking and QRPs is that p-hacking does not consider publication bias. Publication bias implies that researchers fail to publish entire studies with non-significant results. The FPP authors are not concerned about publication bias because their main claim is that p-hacking makes it so easy to obtain significant results that it is unnecessary to discard entire datasets. After showing that a combination of four QRPSs can produce false positive results with a 60% success rate (for alpha = .05), the author hasten to warn readers that this is a conservative estimate because actual researchers might use even more QRPs. “As high as these estimates are, they may actually be conservative” (p. 1361).
The article shook the foundations of mainstream psychology because it suggested that most published results in psychology could be false positive results; that is, a statistically significant results was reported even though the reported effect does not exist. The FPP article provided a timely explanation for Bem’s (2011) controversial finding that humans have extrasensory abilities, which unintentionally contributed to the credibility crisis in social psychology (Simmons, Nelson, & Simonsohn, 2018; Schimmack, 2020).
In 2018, the FPP authors published their own reflection on their impactful article for a special issue of the most highly cited articles in Psychological Science (Simmons et al., 2018). In this article, the authors acknowledge that they used questionable research practices in their work and knew that using these practices was wrong. However, like many other psychologists they thought these practices were harmless because nothing substantial changes when a p-values is .04 rather than .06. Their own article convinced them that their practices were more like robbing a bank than jay walking.
The FPP authors were also asked to critically reflect on their article and to comment on things they might have done differently with the benefit of hindsight. The main regret was the recommendation to require a minimum sample size of n = 20 per cell. After learning about statistical power, they realized that sample sizes should be justified based on power analysis. Otherwise, false positive psychology would simply become false negative psychology where article mostly report non-significant results when effect sizes exist. To increase the credibility of psychological science it is necessary to curb the use of questionable research practices and to increase statistical power (Schimmack, 2020).
The 2018 reflections reinforce the main claim of the 2011 article that (a) p-hacking nil-effects to significance is easy and (b) that many published significant results might be false positive results. A blog post by the FPP authors in 2016 makes clear that the authors consider this to be the core findings of their article (http://datacolada.org/55).

In my critical examination of the FPP article, I challenge both of these claims. First it is important to clarify what the authors mean by “a bit of p-hacking.” To use an analogy, what does a bit of making out mean? Answers range from kissing to intercourse. So, what do you actually have to do to have a 60% probability of getting pregnant? The FPP article falsely suggests that a bit of kissing may get you there. However Table 1 shows that you actually have to f*&% the data to get a significant result.

The table also shows that it gets harder to p-hack results as the alpha criterion decreases. While the combination of four QRPs can produce 81.5% marginally significant results (p < .10), only 21.5% attempts were successful with p < .01 as the significance criterion. One sensible recommendation based on this finding would be to disregard significant results with p-values greater than .01.
Another important finding is that each QRP alone increased the probability of a false positive result only slightly from the nominal 5% to an actual level of no more than 12.6%. Based on these results, I would not claim that it is easy to get false positive results. I consider the combination of four QRPs in every study that is being conducted research fraud that is sanctioned by professional organizations. That is, even if a raid of a laboratory would find that a researcher actually uses this approach to analyze data, the research would not be considered to engage in fraudulent practices by psychological organizations like the Association for Psychological Science or granting agencies.
The distinction between a little and massive is not just a matter of semantics. It influences beliefs about the prevalence of false positive results in psychology journals. If it takes only a little bit of p-hacking to get false positive results, it is reasonable to assume that many published results are false positives. Hence, the title “False Positive Psychology.”
Aside from the simulation study, the FPP article also presents two p-hacked studies. The presentation of these two studies reinforces the narrative that p-hacking virtually guarantees significant results. At least, the authors do not mention that they also ran some additional studies with non-significant results that they did not report. However, their own simulation results suggest that a file-drawer of non-significant studies should exist despite massive p-hacking. After all, the probability to get two significant results in a row with a probability of 60% is only 36%. This means that the authors were lucky to get the desired result, used even more QRPs to ensure a nearly 100% success rate, or failed to disclose a file-drawer of non-significant results. To examine these hypothesis, I simulated their actual p-hacking design of Study 2.
A Z-curve analysis of massive p-hacking
The authors do not disclose how they p-hacked Study 1. For Study 2 they provide the following information. The design had study had three groups (“When I’m Sixty-Four”, “Kalimba”, “Hot Potato”) and the “Hot Potato” condition was dropped like a hot potato. It is not clear how the sample size decreased from 34 to 20 as a result, but maybe participants were not equally assigned to the three conditions and there were 14 participants in the “Hot Potato” condition. The next QRP was that there were two dependent variables; actual age and felt age. Then there were a number of co-variates, including bizarre and silly ones like the square root of 100 to enhance the humor of the article. In total, there were 10 covariates. Finally, the authors used optional stopping. They checked after every 10 participants. It is not specified whether they meant 10 participants per condition or in total, but to increase the chances of a significant result it is better to use smaller increments. So, I assume it was just 3 participants per condition.
To examine the long-run success rate of this p-hacking design, I simulated the following combination of QRPs: (a) three conditions, (b) two dependent variables, (c) 10 covariates, and (d) increasing sample size from n = 10 until N > 200 per condition in steps of 3. I ran 10,000 simulations of this p-hacking design. The first finding was that it provided a success rate of 77% (7718 / 10,000), which is even higher than the 60% success rate featured in the FPP article. Thus, more massive p-hacking partially explains why both studies were significant.
The simulation also produced a new insight into p-hacking by examining the success rates for every increment in sample sizes (Figure 1). It is readily apparent that the chances of a significant result decrease. The reason is that favorable sampling error in the beginning quickly produces significant results. However, unfavorable sampling error in the beginning takes a long time to be reversed.

It follows that no smart p-hacker would use optional stopping or only continue if the first test shows a promising trend. This is what Bem (2011) did to get his significant results (Schimmack, 2016). It is not clear why the FPP authors did not simulate optional stopping. However, the failure to include this QRP explains why they maintain that p-hacking does not leave a file drawer of non-significant results. In theory, adding participants would eventually produce a significant result, resulting in a success rate of 100%. However, in practice resources would often be depleted before a significant result emerges. Thus, even with massive p-hacking a file drawer of non-significant results is inevitable.
It is notable that both studies that are reported in the FPP article have very small sample sizes (Ns = 30, 34). This shows that adding participants does not explain the 100% success rate. This also means that the actual probability of a success on the first trial was only about 40% based on the QRP design for Study 2. This means the chance of getting two significant results in a row was only 16%. This low success rate suggests that the significant p-values in the FPP article are not replicable. I bet that a replication project would produce more non-significant than significant results.
In sum, the FPP article suggested that it is easy to get significant results with a little bit of p-hacking. Careful reading of the article and a new simulation study show that this claim is misleading. It requires massive p-hacking that is difficult to distinguish from fraud to consistently produce significant results in the absence of a real effect and even massive p-hacking is likely to produce a file-drawer of non-significant results unless researchers are willing to continue data collection until sample sizes are very large.
Detecting massive p-hacking
in the wake of the replication crisis, numerous statistical methods have been developed that enable detection of bias introduced by QRPs (Bartos & Schimmack, 2021; Brunner & Schimmack, 2020; Schimmack, 2012; Simonsohn et al., 2014; Schimmack, 2016). The advantage of z-curve is that it also provides valuable additional information such as estimates of the success rate of replication attempts and information about the false discovery risk (Bartos & Schimmack, 2021).
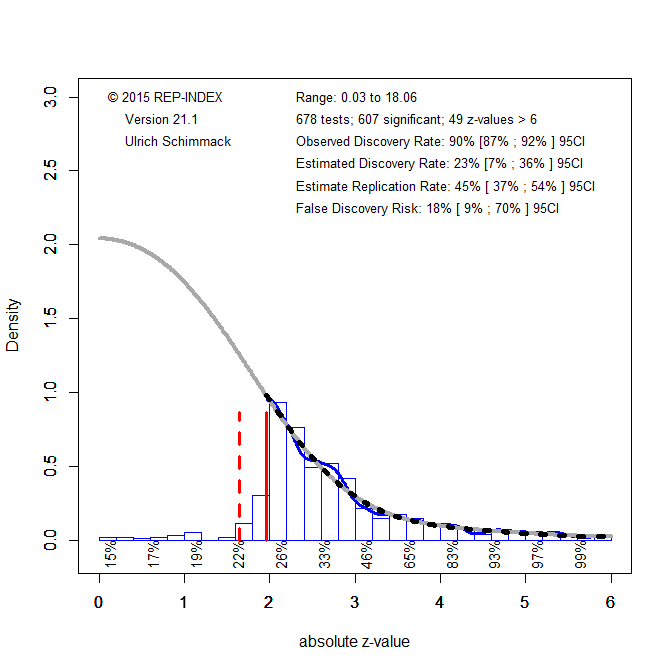
Figure 2 shows the z-curve plot for the 10,000 p-values from the previous simulation of the FPP p-hacking design. To create a z-curve plot, he p-values are converted into z-scores, using the formula qnorm(1-p/2). Accordingly, a p-value of .05 corresponds to a z-score of 1.96 and all z-scores greater than 1.96 (the solid red line) are significant.

Visual inspection shows that z-curve is unable to fit the actual distribution of z-scores because the distribution of actual z-scores is even steeper than z-curve predicts. However, the distinction between p-hacking and other QRPs is irrelevant for the evaluation of evidential value. Z-curve correctly predicts that the actual discovery rate is 5%, which is expected when only false hypotheses are tested with alpha = .05. It also correctly predicts that the probability of a successful replication without QRPs is only 5%. Finally, z-curve also correctly estimates that the false discovery risk is 100%. That is, the distribution of z-scores suggests that all of the significant results are false positive results.
The results address outdated criticisms of bias-detection methods that they merely show the presence of publication bias. First, the methods do not care about the distinction between p-hacking and publication bias. All QRPs inflate the success rate and bias-detection method reveal inflated success rates (Bartos & Schimmack, 2021; Brunner & Schimmack, 2020; Schimmack, 2012). Second, while older methods merely showed the presence of bias, newer methods like z-curve also quantify the amount of bias. Thus, even if bias is always present, they provide valuable information about the amount of bias. In the present example, massive p-hacking produced massive bias in the success rate. Finally, z-curve.2.0 also quantifies the false positive risk after correcting for bias and correctly shows that massively p-hacked nil-hypothesis produces only false positive results.
The simulation also allows to replicate the influence of alpha on the false positive risk. A simple selection model predicts that only 20% of the results that are significant with alpha = .05 are still significant with alpha = .01. This follows from the uniform distribution of p-values, which implies that .01/.05 p-values are below .05 and .01. However, massive p-hacking clusters even more p-values in the range between .01 and .05. In this simulation only 6% (500 / 7718) p-values were below .01. Thus, it is possible to reduce the false positive risk from 100% to close to 5% by disregarding all p-values between .05 and .01. Thus, massive p-hacking provides another reason for calls to adjust the alpha level for statistically significant results to .005 (Benjamin et al., 2017) to reduce the risk of false positive results even for p-hacked literatures.
In sum, since the FPP article was published it has become possible to detect p-hacking in actual data using statistical methods like z-curve. These methods work even when massive p-hacking was used because massive p-hacking makes the detection of bias easier, especially when massive p-hacking is used to produce false positive results. The development of z-curve makes it possible to compare the FPP scenarios with 60% or more false positive results to actual p-values in published journals.
How Prevalent is Massive P-Hacking?
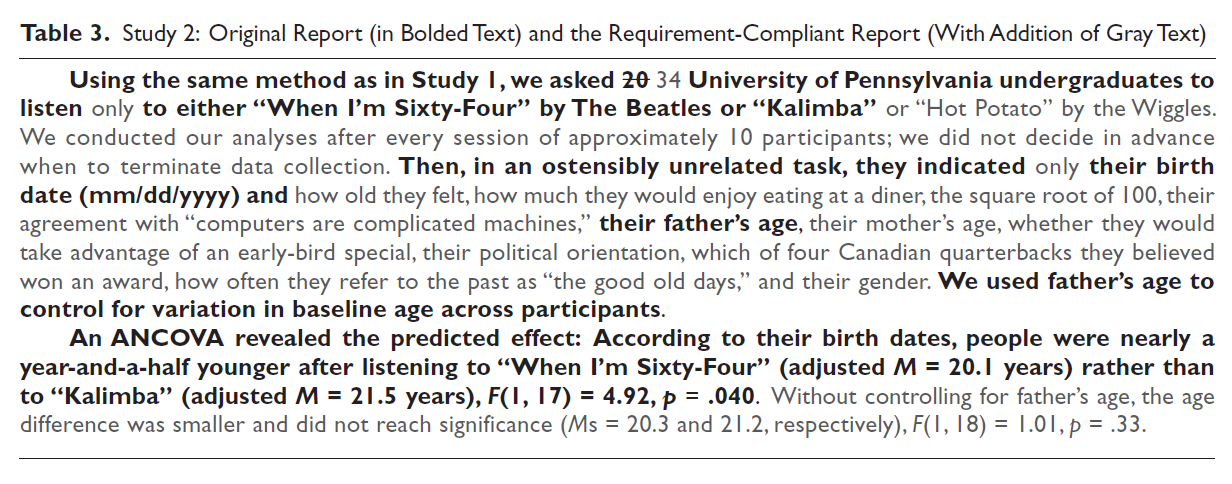
Since the FPP article was published, other articles have examined the prevalence of questionable research practices. Most of these studies rely on surveys (John et al., 2012; Fiedler & Schwarz, 2016). The problem with survey results is that they do not provide sufficient evidence about the amount of p-hacking and do not provide information about the severity of p-hacking. Furthermore, it is possible that many researchers use QRPs when they are testing a real effect. This practice would inflate effect sizes, but does not increase the risk of false positive results. These problems are addressed by z-curve analyses of published results. Figure 3 shows the results for Motyl et al.’s (2017) representative sample of test statistics in social psychology journals.
The z-curve plot of actual p-values differs in several ways from the z-curve plot of massive p-hacking. The estimated discovery rate is 23% and the estimated replication rather is 45%. The point estimate of the false discovery risk is only 18%, suggesting that no more than a quarter of published results are false positives. However, due to the small set of p-values, the 95%CI around the point estimate of the false positive risk reaches all the way to 70%. Thus, it remains unclear how high the false positive risk in social psychology is.
Results from a bigger coding project help to narrow down the uncertainty about the actual EDR in social psychology. This project coded at least 20 focal hypothesis tests from the most highly cited articles by eminent social psychologists, where eminence was based on the H-Index (Radosic & Diener, 2021). This project produced 2,208 p-values. The z-curve analysis of these p-values closely replicated the point estimates for Motyl et al.’s (2017) data (EDRs 26% vs. 23%, ERR 49% vs. 45%, FDR 15% vs. 18%). The confidence intervals are narrower and the upper limit of the false positive risk decreased to 47%.
However, combining the two samples did not notably reduce the confidence interval around the false discovery risk, 15%, 95%CI = 10% to 47%. Thus, up to 50% of published results in social psychology could be false positive results. This is an unacceptably high risk of false positive results, but the risk may seem small in comparison to a scenario where a little bit of p-hacking can produce over 60% false positive results.
In sum, empirical analyses of actual data suggest that false positive results are not as prevalent as the FPP article suggested. The main reason for the relatively low false positive risk is not that QRPs are rare. Rather, QRPs also help to inflate success rates when a small true effect exists. If effect sizes were not important, it might seem justifiable to reduce false negative rates with the help of QRPs. However, effect sizes matter and QRPs produce inflated effect sizes estimates by over 100% (Open Science Collaboration, 2015). Thus, p-hacking is a problem even if it does not generate a high rate of false positive results.
Individual Differences in Massive P-Hacking?
Psychologists study different topics and use different methods. Some research areas and some research methods have many true effects and high power to detect them. For example, cognitive psychologists appears to have few false positive results and relatively high replication rates (Open Science Collaboration, 2015; Schimmack, 2020). In contrast, between-subject experiments in social psychology are the most likely candidate for massive p-hacking and high rates of false positive results (Schimmack, 2020). As researchers focus on specific topics and paradigms, they are more or less likely to require massive p-hacking to produce significant results. To examine this variation across researchers, I combined the data from the 10 eminent social psychologists with the lowest EDR.
The results are disturbing. The EDR of 6% is just one percentage point above the 5% that is expected when only nil-hypotheses are tested and the 95%CI includes 5%. The upper limit reaches only 14%. The corresponding false discovery risk is 76% and the 95%CI includes 100%. Thus, the FPP article may describe the actual practices of some psychologists, but not the practices of psychology in general. It may not be surprising that one of the authors of the FPP article has a low EDR of 16%, even if the analysis is not limited to focal tests (Schimmack, 2021). It is well-known that the consensus bias leads individuals to project themselves onto others. The present results suggest that massive p-hacking of true null-results is the exception rather than the norm in psychology.

The last figure shows the z-curve plot for the 10 social psychologists with the highest EDR. The z-curve looks very different and shows that not all researchers were massive p-hackers. There is still publication bias because the ODR, 91%, matches the upper limit of the 95%CI of the EDR, 66% to 91%, but the effect size is much smaller (91% – 78% = 13%) than for the other extreme group (90% – 6% = 84%). As this comparison is based on extreme group, a replication study would show a smaller difference due to regression to the mean, but the difference is likely to remain substantial.

In sum, z-curve analysis of actual data can be used to evaluate how prevalent massive p-hacking actually is. The results suggest that only a minority of psychologists consistently used massive p-hacking to produce significant results that have a high risk of being false positive results.
Discussion
The FPP article made an important positive contribution to psychological science. The recommendations motivated some journals and editors to implement policies that discourage the use of QRPs and motivate researchers to preregister their data analysis plans. At the same time, the FPP article also had some negative consequences. The main problem with the article is that it ignored statistical power, false negatives, and effect sizes. That is, the article suggested that the main problem in psychological science is a high risk of false positive results. Instead, the key problem in psychological science remains qualitative thinking in terms of true and false hypotheses that is rooted in the nil-hypothesis ritual that is still being taught to undergraduate and graduate students. Psychological science will only advance by replacing nil-hypothesis testing with quantitative statistics that take effect sizes into account. However, the FPP article succeeded where previous meta-psychologists failed by suggesting that most published results are false positives. It therefore stimulated much needed reforms that decades of methodological criticism failed to deliver.
False False Positive Psychology
The main claim of the FPP article was that many published results in psychology journals could be false positives. Unfortunately, the focus on false positive results has created a lot of confusion and misguided attempts to quantify false positive results in psychology. The problem with false positives is that they are mathematical entities rather than empirically observable phenomena. Based on the logic of nil-hypothesis testing, a false positive result requires an effect size that is exactly zero. Even a significant result with a population effect size of d = 0.0000000001 would count as a true positive result, although it is only possible to produce significant results for this effect size with massive p-hacking.
Thus, it is not very meaningful to worry about false positive results. For example, ego-depletion researchers have seen effect sizes reduced from d = 6 to d = .1 in studies without p-hacking. Proponents of ego-depletion point to these fact that d = .1 is different from 0 and supports their theory. However, the honest effect size invalidates hundreds of studies that claim to have demonstrate the effect for different dependent variables and under different conditions. None of these p-hacked studies are credible and each one would require a new replication study with over 1,000 participants to see whether the small effect size is really observed for a specific outcome under specific conditions. Whether the effect size is really zero or small is entirely irrelevant.
A study with a N = 40 participants and d = .1 has only 6% power to produce a significant result. Thus, there is hardly a difference between a study with a true null-effect (5% power) and a study with a small effect size. Nothing is learned from a significant result in either case and as Cohen once said “God hates studies with 5% power as much as studies with 6% power.”
To demonstrate that an effect is real, it is important to show that the majority of studies are successful without the use of questionable research practices (Brunner & Schimmack, 2020; Cohen, 1994). Thus, the empirical foundation of a real science requires (a) making true predictions, (b) designing studies that can provide evidence for the prediction, and (c) honest reporting of results. The FPP article illustrated the importance of honest reporting of results. It did not address the other problems that have plagued psychological science since its inception. As Cohen pointed out, results have to be replicable, and to be replicable, studies need high power. Honest reporting alone is insufficient.
P-Hacking versus Publication Bias
In my opinion, the main problem of the FPP article is the implicit claim that publication bias is less important than p-hacking. This attitude has led the authors to claim that bias detection tools are irrelevant because “we already know that researchers do not report 100% of their nonsignificant studies and analyses” (Nelson, Simmons, & Simonsohn, 2018). This argument is invalid for several reasons. Most important, bias detection tools do not distinguish between p-hacking and publication bias. As demonstrated here, they detect p-hacking as well as publication bias. For the integrity of a science it is also not important whether 1 researcher tests 20 dependent variables in one study or 20 researchers test 1 dependent variable in 20 independent studies. As long as results are only reported when they are significant, p-hacking and publication bias introduce bias in the literature and undermine the credibility of a science.
It is also unwarranted to make the strong claim that publication bias is unavoidable. Pre-registration and registered reports are designed to ensure that there is no bias in the reporting of results. Bias-detection methods can be used to verify this assumption. For example, they show no bias in the replication studies of the Open Science Collaboration project.
Third, new developments in bias detection methods do not only test for the presence of bias. As shown here, a comparison of the ODR and EDR provides a quantitative estimate of the amount of bias and small amounts of bias have no practical implications for the credibility of findings.
In conclusion, it makes no sense to draw a sharp line between hiding of dependent variables and hiding of entire studies. All questionable research practices produce bias and massive use of QRPs leads to more bias. Bias-detection methods play an important role in verifying that published results can be trusted.
Reading a Questionable Literature
One overlooked implication of the FPP article is the finding that it is much harder to produce significant results with p-hacking if the significance criterion is lowered from .05 to .01. This provides an easy solution to the problem how psychologists should interpret findings in psychology journals with dramatically inflated success rates (Sterling, 1959; Sterling et al., 1995). The success rate and the false positive risk can be reduced by adjusting alpha to .01 or even .005 (Benjamin et al., 2017). This way it is possible to build on some published results that produced credible evidence.
Conclusion
The FPP article was an important stepping stone in the evolution of psychology towards becoming a respectable science. It alerted many psychologists who were exploiting questionable research practices to various degrees that these practices were undermining the credibility of psychology as a science. However, one constant in science is that science is always evolving. The other one is that scientists who made a significant contribution think that they reached the end of history. In this article, I showed that meta-psychology has evolved over the past decade since the FPP article appeared. Ten years later, it is clear that massive p-hacking of nil-results is the exception rather than the norm in psychological science. As a result, the false positive risk is lower than feared ten years ago. However, this does not imply that psychological science is credible. The reason is that success rates and effect sizes in psychology journals are severely inflated by the use of questionable research practices. This makes it difficult to trust published results. One overlooked implication of the FPP article is that p-values below .01 are much more trustworthy than p-values below .05 because massive p-hacking mostly produces p-values between .05 and .01. Thus, one recommendation for readers of psychology journals is to ignore results with p-values greater than .01. Finally, bias detection tools like z-curve can be used to assess the credibility of published literatures and to correct for the bias introduced by questionable research practices.