Joey loves crowds. He is boisterous, speaks with a loud and booming voice, and is always ready to high-five everybody. No, I am not describing a super-spreader of Covid-19. It is a textbook description or caricature of an extrovert, or as personality psychologists say extravert.
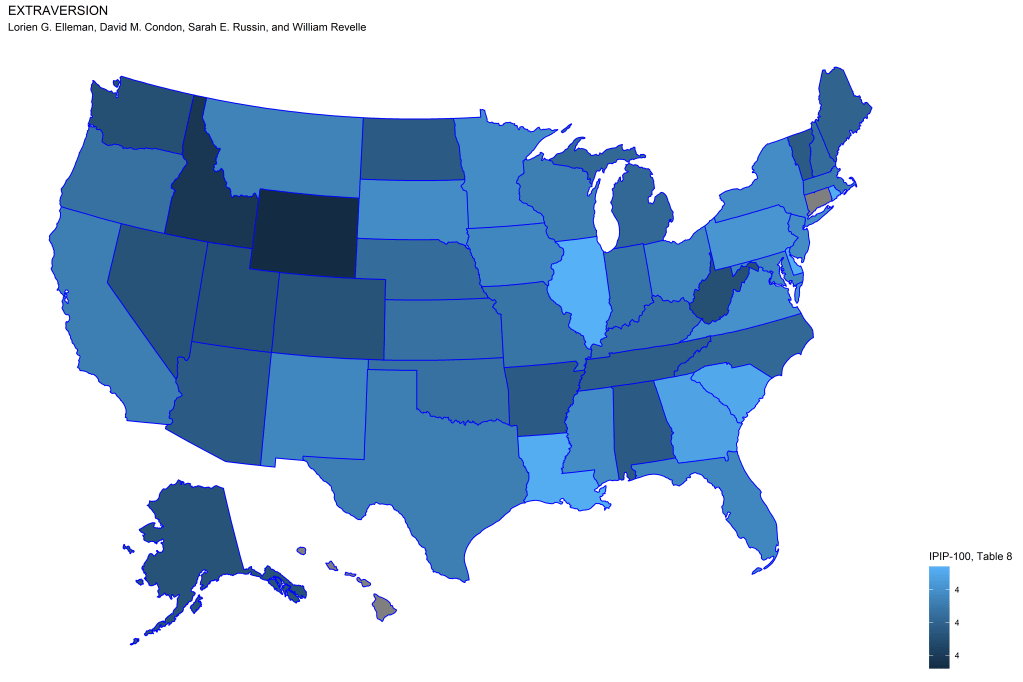
Personality psychologists have studied extraversion and introversion for nearly one-hundred years, although most of the research emerged in the past 40 years. We know that extraversion is a heritable trait that runs in families. We know that it remains fairly stable throughout adulthood, and we know that it influences behavior. There also has been research on regional variation in extraversion across the world and across US states (Elleman, Condon, Russin, & Revelle, 2018). I used their data to create the map of extraversion for US states. The map shows the highest level of extraversion in Illinois and the lowest level of extraversion in Wyoming followed by Idaho and Utah. While Illinois has fairly high rates of Covid-19, especially in Chicagoland, Wyoming and Idaho have relatively low levels of positive cases. They are also solid “red” states who voted for Trump in the 2016 election with 67% and 59%. It is therefore possible that extraversion partially explains why Covid-19 is more prevalent in “blue” (liberal) states. Residents in blue states may be more extraverted and may have a harder time to follow social distancing rules.
Of course, extraversion would only be one of several factors that play a role. Another obvious factor is that urban areas are more strongly affected by Covid-19 than rural areas, and rural voters are more likely to vote for Trump. There are many other possible differences among the US states that might play a role, but preliminary analysis suggests that they do not predict Covid-19 to a substantial degree. So, to keep things short, I will focus on the two factors that I found to be significant predictors of the spread of Covid-19: urbanization and extraversion.
To examine whether this relationship is stable over time, I used confirmed positive cases reported on the Covid-Tracking website and created indicators for three, three-week periods: March 23 to April 12, April 13 to May 3, and May 4 to May 24. Predictor variables were (a) the percentage of votes for Trump in the 2016 election, (b) extraversion scores from the supplement to Elleman et al.’s article (Table 8), and (c) urbanization scores (wikipedia).
The data were analyzed using structural equation modeling to examine the relationship among the six variables. [I also examined more complex models that included deaths. The effects of the predictor variables on death were mostly mediated by confirmed positives, with the exception of a unique, negative relationship between Trump support and deaths at time 1 only.] Model fit was excellent, CFI = 1.00, RMSEA = .000. This does not mean that the model reveals the truth, but it does show that the model is consistent with the data. Thus, the model tells one possible story about the negative relationship between Trump support and Covid-19 deaths across the states.

The numbers show that urbanity is much stronger negative predictor of Trump support than extraversion. The effect of extraversion is small, and not statistically significant by conventional standards, but there are only 49 states (I excluded the island state Hawaii), making it hard to get statistical significance. The effect of urbanization and extraversion are more equal and explain a notable amount of variation in Covid-19 cases across states. The numbers also show that the effect is not getting weaker over time. It may actually become stronger. This means that both urbanization and extraversion are stable predictors of the Covid-19 pandemic in the USA. Even in the past three weeks, after several states with Republican governors eased restrictions, there is no evidence that cases are increasing notably in red states.
It is not difficult to find newspaper articles that talk about a second wave and spikes in new cases in Texas or other red states. These stories are based on the idea that red states are ignoring the danger of Covid-19, but so far this idea lacks empirical support. For every story of a pastor who died of Covid-19 after defying stay-at-home orders, there are thousands of churches who are holding services online, and hundreds of people flouting social-distancing norms in Central Park, NY. Don’t get me wrong. Trump’s disregard of science and ramblings about light therapy are a disgrace, but this does not mean that 40% of the US population follows the covidiot in the White House and drinks bleach. At least forty-percent of US voters are likely to vote for him again. Don’t ask me how anybody can vote for him again. That is not the point of this blog post. The blog post is about the empirical fact that so far Covid-19 has predominantly hit states that did not vote for Trump. I suggest that this seemingly paradox finding is not paradox at all. Joey, the extraverted bachelor who lives in an apartment in New York City, who voted for Hillary is much more likely to get infected than Joyce who lives with her family on a farm in Wyoming. Painting all Trump-voters as covidiots would be a similar mistake as Hillary Clinton calling Trump-supporters a “basket of deplorables.” If all Trump-supporters were covid-idiots, we should have seen a positive relationship between Trump-support and Covid-19 cases, especially after controlling for confounding variables like urbanization and extraversion. The fact that this positive relationship stubbornly refuses to emerge may suggest that Republican governors and residents in red states are not as stupid as their leader.