Zou, C., Schimmack, U., & Gere J. (2013). The Validity of Well-Being Measures: A Multiple-Indicator–Multiple-Rater Model. Psychological Assessment, 25(4), 1247–1254.
ABSTRACT
In the subjective indicators tradition, well-being is defined as a match between an individual’s actual life and his or her ideal life. Common well-being indicators are life-satisfaction judgments, domain satis- faction judgments, and measures of positive and negative affect (hedonic balance). These well-being indicators are routinely used to study well-being, but a formal measurement model of well-being is lacking. This article introduces a measurement model of well-being and examines the validity of self-ratings and informant ratings of well-being. Participants were 335 families (1 student with 2 parents, N = 1,005). The main findings were that (a) self-ratings and informant ratings are equally valid, (b) global life-satisfaction judgments and averaged domain satisfaction judgments are about equally valid, and (c) about 1/3 of the variance in a single indicator is valid. The main implication is that researchers should demonstrate convergent validity across multiple indicators by multiple raters.
Keywords: life satisfaction, affect, self-reports, informant-reports, multitrait–multimethod
Well-being is an important goal for many people, thus, social scientists from a variety of disciplines study well-being. A major problem for well-being scientists is that well-being is difficult to define and measure (Diener, Lucas, Schimmack, & Helliwell, 2009). These difficulties may threaten the validity of well-being measures. The aim of the present study is to examine the validity of the most commonly used measures of well-being.
A measure is valid if it measures what it is intended to measure. This definition of validity implies that it is important to define a construct (i.e., what is being measured?) before it is possible to evaluate the validity of a measure (Schimmack, 2010). Unfortu- nately, there is no agreement about the definition of the term well-being (Diener et al., 2009). It is therefore necessary to explain how we define the term well-being before we can examine the validity of well-being measures. We agree with philosophical arguments that well-being is a subjective concept (Diener, 1984; Sumner, 1996; see Diener, Suh, Lucas, & Smith, 1999, for a detailed discussion). A key criterion of a subjective definition of well-being is that the evaluation has to take the subjective values, motives, and ideals of individuals into account; that is, is his or her life going well for him or her? Accordingly, we define well-being as a match between an individual’s actual life and his or her ideal life. This definition is consistent with the prevalent definition of well-being in the social indicators tradition (Andrews & Withey, 1976; Cantril, 1965; Diener, 1984; Veenhoven & Jonkers, 1984). This definition of well-being led to the creation of subjective well-being indicators such as life-satisfaction judgments (Diener, 1984). These measures are routinely used to make inferences about the determinants of well-being. These inferences implicitly assume that well-being measures are valid, but the literature on the validity of these measures is sparse and controversial (Schwarz & Strack, 1999; Schimmack & Oishi, 2005; Schneider & Schimmack, 2009). Since there is no gold standard to validate well-being measures, convergent validity between self-ratings and informant ratings of well-being has been used as the primary evidence for the validity of well-being measures (Diener et al., 2009). However, a major limitation of previous studies is that they did not provide quanti- tative information about the amount of valid variance in different well-being measures (cf. Schneider & Schimmack, 2009). Our study addresses this problem and provides the first quantitative estimates of the amount of valid variance in the most widely used measures of well-being.
One problem in the estimation of effect sizes is that estimates based on small samples are imprecise because sampling error is substantial. To obtain data from a large sample, we used a round- robin design. In this design, participants are both targets and informants, thus, increasing the number of targets. To ensure that informants have valid information about targets’ well-being, we used families as units of analysis. Specifically, we recruited uni- versity students and their biological parents (see Table 1).
A round-robin design creates two problems for a standard struc- tural equation model. First, observations are not independent be- cause participants are recruited as triads rather than as individuals. Second, the distinction between the three raters (student, mother, & father) does not provide information about the validity of self-ratings because self-ratings are a function of rater and target (i.e., the diagonal in Table 1).
To overcome these problems, we made use of advanced features in the structural equation modeling program Mplus 5.0 (Muthén & Muthén, 2007). First, we used the CLUSTER command to obtain adjusted standard errors and fit indices that take the interdepen- dence among family members into account. Second, we rearranged the data to create variables with self-ratings (see Table 2). This creates missing data in the diagonal of the traditional round-robin design. To analyze these data with missing values we used the MODEL = COMPLEX function of Mplus (Muthén & Muthén, 2007). Thus, our model included 16 (4 raters X 4 measures) observed variables.
A Measurement Model of Well-Being
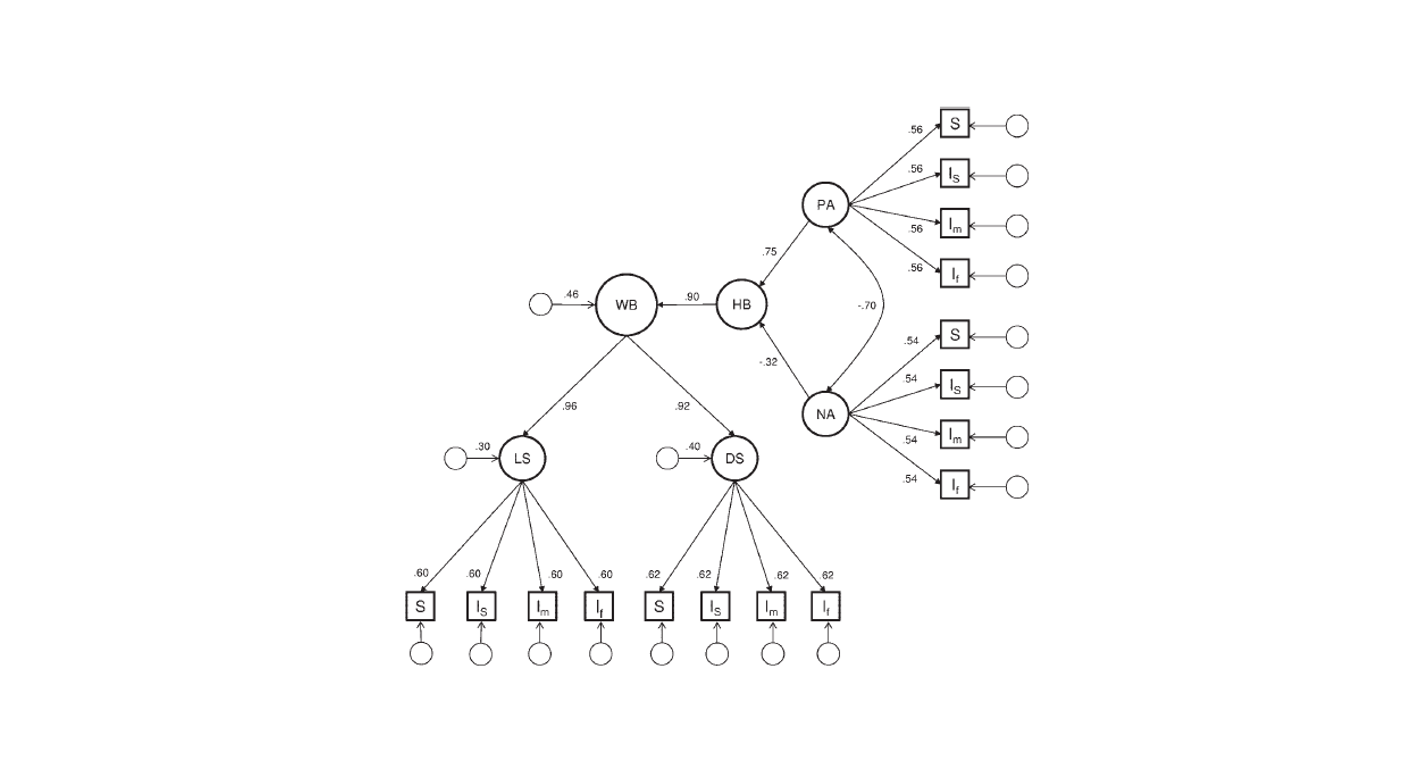
Quantitative estimates of validity require a formal measurement model in which variation in well-being (the match between indi- viduals’ actual and ideal lives) is an unobserved cause that pro- duces variation in observed well-being measures (e.g., self-ratings of life-satisfaction; cf. Schimmack, 2010). Our measurement model of well-being (see Figure 1) is similar to Diener et al.’s (1999) theoretical model of well-being. It is also related to the causal systems model of subjective well-being (Busseri & Sadava, 2011). In this model, positive affect and negative affect are distinct affective experiences. For most people, feeling good and not feeling bad is an important part of an ideal life, and the balance of positive versus negative affect serves as an important basis for life-satisfaction judgments (Schimmack, Radhakrishnan, Oishi, Dzokoto, & Ahadi, 2002; Suh, Diener, Oishi, & Triandis, 1998). Consistent with these assumptions, positive affect and negative affect are distinct components of hedonic balance (using a forma- tive measurement model), and hedonic balance influences well- being. The formative measurement model of hedonic balance makes no assumptions about the correlation between its compo- nents. As prior research often reveals a moderate negative corre- lation between positive affect and negative affect, our model allows for the two components to correlate with each other (Diener, Smith, & Fujita, 1995; Gere & Schimmack, 2011). The well-being factor is identified by two satisfaction measures, global life-satisfaction judgments and averaged domain satisfaction judgments. Prior studies often relied exclusively on global life-satisfaction judgments (Lucas, Diener, & Suh, 1996; Walker & Schimmack, 2008). The problem with this approach is that global life-satisfaction judgments can be influenced by focusing illusions (Kahneman, Krueger, Schkade, Schwarz, & Stone, 2006; but see Schimmack & Oishi, 2005). Focusing illusions could produce systematic measurement error in global life-satisfaction judgments that could attenuate the influence of hedonic balance on well- being. To address this concern, our model included averaged domain satisfaction judgments as a second indicator of well-being. As averaged domain satisfaction judgments are not susceptible to focusing illusions, the focusing illusion hypothesis predicts that averaged domain satisfaction judgments have a higher loading on the well-being factor (i.e., are more valid) than global life- satisfaction judgments.

Figure 1 does not show how our model incorporated systematic rater biases. For each rater, we created a single bias factor. This factor represents general evaluative biases in self-ratings and rat- ings of others that influence personality and well-being ratings (Anusic, Schimmack, Pinkus & Lockwood, 2009; Kim, Schim- mack, & Oishi, 2012; Schimmack, Schupp, & Wagner, 2008).


The Present Study
Model fit was assessed using standard criteria of acceptable model fit such as a comparative fit index (CFI) < .95, root-mean- square error of approximation (RMSEA) < .06, and standardized root-mean-square residual (RMSR) < .08 (Schermelleh-Engel, Moosbrugger, & Muller, 2003). Due to the large sample size of the present data (N = 1,005), tests of model comparison using p-values will often lead to misleading results (cf. Raftery, 1995). Therefore, we used the Bayesian information criterion (BIC) for model comparisons. Models with lower BIC values are preferable because they are more parsimonious. This is especially important in new research areas because small effects are less likely to replicate. Following Raftery’s (1995) standards, a difference in BIC values greater than 10 can be interpreted as very strong evidence to support the model with the lower BIC value.
Method
Participants were 335 students at the University of Toronto and their parents (335 triads; N = 1,005). Of the 335 students, 235 were women and 100 were men, and the age ranged from 17 to 30 years (Mage = 19.56, SD = 2.23). The age of mothers ranged from 37 to 63 years (Mage = 48.25, SD = 5.08). The age of fathers ranged from 38 to 72 years (Mage = 51.67, SD = 5.67). Students were required to be living with both of their biological parents so that each member of the family had good knowledge of one another. Students from the university took part in the study for either $25 or course credit. Their parents each received $25 for participating in the study. Two hundred thirty-five students came to the laboratory with their parents to complete the study. One hundred students and their parents completed the study in their homes.
Participants who came into the laboratory filled out consent forms, and these participants were seated in separate rooms to ensure that reports were made independently. They filled out a series of questionnaires about themselves and about the other two members of their families. They were then debriefed and thanked for their participation. Students who took the questionnaires home met with a researcher who gave them detailed instructions and the questionnaire packages. Participants were asked to fill out the questionnaires in separate rooms and refrain from talking about their responses until all members of the family have completed the questionnaire. Each family member received an envelope, into which the family member placed his or her own completed ques- tionnaire, and he or she sealed the envelope and signed it across the flap. Once the questionnaire packages were completed, partici- pants returned the questionnaire packages, and they were debriefed and thanked for their participation.
Measures
Since well-being is defined as an evaluation of an individual’s actual life, the assessment of well-being has to be retrospective. For this reason, we asked participants to think about the past 6 months when answering the questions. Additionally, since global judgments of life satisfaction can be influenced by temporarily accessible information (Schimmack & Oishi, 2005; Schwarz & Strack, 1999), the global self-ratings of life satisfaction were assessed first.
Global life evaluation. For the global evaluative judgments, the first three items of the Satisfaction With Life Scale were used (SWLS; Diener, Emmons, Larsen, & Griffin, 1985). The items ask participants to evaluate their lives on a 7-point Likert scale ranging from 1 (strongly disagree) to 7 (strongly agree). The first three items (“In most ways my life is close to my ideal”; “The conditions of my life are excellent”; “I am satisfied with my life”) were chosen because they have been shown to have better psychometric prop- erties than the last two items of the scale (Oishi, 2006). Consistent with prior studies, the internal consistency of the three-item scale was good, alphas > .80 (C= .83 for students; C= .89 for mothers; C = .89 for fathers). The items for the informant reports were virtually the same, but the wording was changed to an informant report format (e.g., Kim et al., 2012). Informants were instructed to fill out the scale from the target’s perspective. For example, students serving as informants for their father would rate “In most ways my father thinks that his life is close to his ideal.” Ratings were made on 7-point Likert scales. The internal consistency of informant-ratings was similar to the internal consistency of self- ratings (ranged from C = .85 to C = .93).
Averaged domain satisfaction. Domain satisfaction was as- sessed with single-item indicators for six important life domains, using satisfaction judgments (I am satisfied with..). The life do- mains were romantic life, work/academic life, health, recreational life, housing, and friendships. Responses were made on 7-point Likert scales ranging from 1 (strongly disagree) to 7 (strongly agree). The domains were chosen based on previous studies show- ing that these domains are rated as moderately to very important (Schimmack, Diener, & Oishi, 2002). We averaged these items to obtain an alternative measure of life evaluations. The informant version of the questionnaire changed the stem from “I am . . . ” to “My son/daughter/mother/father is . . . ” and “my” to “his/her.”
Positive and negative affect. Positive and negative affect were assessed using the Hedonic Balance Scale (Schimmack et al., 2002). The scale has three items for positive affect (pleasant, positive, good) and three items for negative affect (unpleasant, negative, bad). The items for positive and negative affect were averaged separately to create composites for positive and negative affect, respectively. All of the self-ratings for positive affect had a reliability of over .80 (C = .82 for students; C = .85 for mothers; C = .85 for fathers). Similarly, all of the self-ratings for negative affect had a reliability of over .75 (C = .80 for students; C = .75 for mothers; C = .78 for fathers). For the informant reports, “. . . how often do you experience the following feelings?” was re- placed with “. . . how often does your mother/father/son/daughter experience the following feelings?” All of the informant reports had reliabilities of over .75 (range from C = .75 to C = .89).
Results
Multitrait–Multimethod Matrix
Table 3 shows the correlations among the 16 variables created by crossing the four indicators (life satisfaction, domain satisfac- tion, positive affect, and negative affect) with the four raters (self, student informant, mother informant, and father informant). Note that since the self cannot also serve as the informant for the self, correlations between self-reports and informant reports are based on 66% of all observations. The correlations between the self- report measures were based on 100% of the observations.

Correlations between the same construct assessed with different methods (i.e., convergent validity coefficients) are bolded. All of the convergent validity coefficients were significantly greater than zero and exceeded a minimum value of r = .25. Convergent validity correlations for affective indicators (positive affect and negative affect) were lower than correlations for the evaluative indicators (life satisfaction and domain satisfaction). These find- ings replicate the results of a meta-analysis (Schneider & Schim- mack, 2009).
Table 3 can also be used to examine whether each indicator measures well-being in a slightly different manner. Twenty-two out of 24 cross-indicator– cross-rater correlations were weaker than the convergent validity coefficients, indicating that the dif- ferent indicators have unique variance. This finding replicates Lucas et al.’s (1996). However, Table 3 also shows that all well-being measures are related to each other. This pattern of results is consistent with the assumption that all measures reflect a common construct.Table 3 also shows stronger same-rater correlations than cross- rater correlations. This pattern is consistent with our assumption that ratings by a single rater are influenced by an evaluative bias (Anusic et al., 2009; Campbell & Fiske, 1959). Most important, Table 3 provides new information about informant–informant agreement. One notable pattern in the data is that the correlations between informant ratings by mothers (mother informant) and fathers (father informant) were stronger than correlations of infor- mant ratings by parents with those by students as informants. There are two possible explanations for this pattern. First, it is possible that students’ informant reports are less valid than par- ents’ informant ratings. However, this interpretation of the data is inconsistent with the finding that self-ratings were more highly correlated with students’ informant ratings than with parents’ informant ratings. Therefore, we favor the second explanation that parents’ informant ratings share method variance. This interpreta- tion is also consistent with other multirater studies that have demonstrated shared method variance between parents’ ratings of their children’s personality (Funder, Kolar, & Blackman, 1995).
Structural Equation Modeling
We fitted the measurement model in Figure 1 to our data. In the first model, we did not constrain coefficients. This model served as the base-model for model comparisons to more parsimonious models with constrained coefficients. The first model with uncon- strained coefficients had acceptable fit to the data, x2(df = 78) = 104.41, CFI = 0.995, RMSEA = 0.018, standardized root-mean- square residual (SRMR) = 0.026; BIC = 31,102. Factor loadings of ratings by different raters of the same measure (e.g., life- satisfaction) showed very similar loadings. We therefore specified a model that constrained factor loadings and residuals for the four raters to be equal. This model implies that ratings by different raters are equally valid. The model with constrained parameters maintained good fit and had a lower (i.e., superior) BIC value, x2(df = 102) = 148.18, CFI = 0.991, RMSEA = 0.021, SRMR = 0.041; BIC = 30,993. In the next model, we constrained the loadings on the rater-specific bias factors to be equal across raters. Again, model fit remained acceptable, and BIC decreased, indicating that rater bias is similar across raters x2(df = 117) = 188.48, CFI = 0.986, RMSEA = 0.025, SRMR = 0.068; BIC = 30,936. We retained this model as the final model. The parameter estimates of the final model and their 95% confidence intervals are listed in Table 4. For ease of interpretation, the main parameter estimates are also included in Figure 1.
The main finding was that the life-satisfaction factor and the average domain satisfaction factor had very high loadings on the well-being factor. Thus, our results provide no support for the hypothesis that focusing illusions undermine the validity of global life-satisfaction judgments. We also found a very strong effect of hedonic balance on the well-being factor. Yet, all three measures of well-being had significant residual variances, indicating that the measures are not redundant. Most important, about 20% of the variance in well-being was not accounted for by hedonic balance. This suggests that affective measures and evaluative judgments can show divergent patterns of correlations with predictor variables.
The factor loadings of the observed variables on the factor representing the shared variance among raters (e.g., self-ratings of life satisfaction [LS] on LS factor) can be interpreted as validity coefficients for specific constructs (e.g., the validity of a self-rating of life-satisfaction as a measure of life-satisfaction; cf. Schimmack, 2010). The validity coefficients of the four types of indicators were very similar (see Table 4). The validity coefficients suggest that about one third (29% to 38%) of the variance in a single indicator by a single rater (e.g., self-ratings of life- satisfaction) is valid variance.
It is important to keep in mind that these estimates examine the validity of a single rater with regard to a specific measure of well-being rather than the validity of these measures as measures of well-being. To examine the validity of specific measures as measures of the well-being factor in our measurement model, we need to estimate indirect effects of the well-being factor on specific measures. For example, self-ratings of life satisfaction load at .60 on the life satisfaction factor. However, this does not mean that self-ratings of life satisfaction capture 36% (.6*.6) of valid variance of well-being, because life satisfaction is not a perfect indicator of well-being. Based on our model, the life satisfaction factor loads at .96 on the well-being factor. We also need to take this measurement error into account to examine the validity of self- ratings of life satisfaction in assessing well-being (.96*.60 = .58, valid variance = 33%).

Discussion
Our study provides the first quantitative estimates of the validity of various well-being measures using a theoretically grounded model of well-being. Our main findings were that (a) about one third of the variance in a single well-being indicator is valid variance, (b) self-ratings are neither significantly more nor less valid than ratings by a single well-acquainted informant, (c) a large portion of the valid variance in a specific type of indicator is shared across indicators, and (d) hedonic balance and evaluative judgments have some unique variance.
We found no support for the focusing illusion hypothesis. If the distinction between hedonic balance and global life-satisfaction judgments were caused by a focusing illusion, the factor loading of life satisfaction on well-being should have been lower than the factor loading of the average domain satisfaction judgment. However, the actual results showed a slightly reversed pattern. This suggests that unique variance in evaluative judgments reflects valid well-being variance because individuals do not rely exclusively on hedonic balance to evaluate their lives. This finding provides empirical support for philosophical arguments against purely hedonistic definitions of well-being (Sumner, 1996). At the same time, the overlap between evaluative judgments and hedonic balance is substantial, indicating that positive experiences make an important contribution to well-being for most individuals. Another noteworthy finding was that global life-satisfaction judgments and averaged domain satisfaction judgments were approximately equally valid. This finding contradicts previous findings that averaged domain satisfaction judgments were more valid in a study with friends as informants (Schneider & Schimmack,
2010). Future research needs to examine whether the type of informant is a moderator. For example, it is possible that global life-satisfaction judgments are more difficult to make, which gives family members an advantage over friends. Subsequently, we discuss the main implications of our findings for the use of well-being measures in the assessment of individuals’ well-being and for the use of well-being measures in policy decisions.
Validity of Well-Being Indicators
Our results suggest that about one third of the variance in a
single well-being indicator by a single rater is valid variance. This
finding has important implications for the interpretation of studies
that rely on a single well-being indicator as a measure of wellbeing.
For example, many important findings about well-being are
based on a single global life-satisfaction rating in the German
Socio-Economic Panel (e.g., Lucas & Schimmack, 2009). It is
well-known that observed effect sizes in these studies are attenuated
by random measurement error and that it would be desirable
to correct effect size estimates for unreliability (Schmidt & Hunter,
1996). However, systematic measurement error can further attenuate
observed effect sizes. Schimmack (2010) proposed that quantitative
estimates of validity could be used to disattenuate observed
effect sizes for invalidity. To illustrate the implications of correcting
for invalidity in well-being indicators, we use Kahneman et
al.’s (2006) finding that household income was a moderate predictor
of self-reported life-satisfaction (r .32). Our findings
suggest that this observed relationship underestimates the relationship
between household income and well-being. To disattenuate
the observed relationship, the observed correlation has to be divided
by the validity coefficient (i.e., .96 .60 .58). Thus, the
corrected estimate of the true effect size would increase to r .56
(.32/.58), which is considered a strong effect size (Cohen, 1992).
Researchers may be reluctant to trust adjusted effect sizes because
they rely on assumptions about validity. However, the common
practice of relying on observed relationships as estimates of
effect sizes also relies on an implicit assumption, namely, that the
observed measure is perfectly valid. In comparison to an assumption of 100% valid variance in a single global life-satisfaction judgment, our estimate of about one-third valid variance is more realistic and supported by empirical evidence. Nevertheless, our findings should only be treated as a first estimate and a benchmark for future studies. Future research needs to replicate our findings and examine moderating factors of validity in well-being measures.
Self-Reports Versus Informant Reports
Schneider and Schimmack (2009) noted that previous studies failed to compare the validity of self-ratings and informant ratings. Our results suggest that self-ratings and ratings by a single well- acquainted informant are approximately equally valid. While this is a surprising finding given the subjective nature of well-being, it is not uncommon in personality psychology to find evidence of equal or sometimes greater validity in informant ratings than self-ratings. For instance, informant reports of personality often provide better predictive validity than self-reports (e.g., Kolar, Funder, & Colvin, 1996). Since we did not have any outcome measure of well-being (e.g., suicide) in the present study, we could not test for the predictive validity of self- and informant reports. However, this is an important avenue for future research. To our knowledge, no study has compared self-ratings and informant ratings using life-events that are known to influence well-being such as marriage, divorce, or unemployment (Diener, Lucas, & Scollon, 2006).
Informant ratings also have an important advantage over self- ratings. Namely, it is possible to obtain ratings from multiple informants, but there is only one self to provide self-ratings. Aggregation of informant ratings can substantially increase the validity of informant ratings. We computed well-being indicators for single raters and multiple raters using the following weights (Well-Being = 1.5 Life Satisfaction + 1.5 Domain Satisfaction + 2 Positive Affect – 1 Negative Affect) and computed the corre- lation with the well-being factor in Figure 1. The correlations were r = .62 for self-ratings, r = .77 for an aggregate of three informant ratings, and r = .81 for an aggregate of all four ratings. Although the difference between .62 and .77 may not seem impressive, it implies that aggregation across raters can increase the amount of valid variance from one third to two thirds of the observed vari- ance. This finding suggests that clinicians can benefit considerably from obtaining well-being measures from multiple informants to assess individuals’ well-being.
Limitations
Our study has numerous limitations. The use of a convenience sample from a specific population means that the generalizability of our findings needs to be examined in samples drawn from other populations. However, our results are broadly consistent with meta-analytic findings (Schneider & Schimmack, 2009). Another limitation was that parents are not independent raters and appear to share rating biases. In the future, it would be desirable to obtain ratings from independent raters (e.g., friends & parents). Finally, our conclusions are limited by the assumptions of our model. While it is possible to fit other models to our data in Table 3 (e.g., Busseri & Sadava, 2011), the alternative models each have their own limitations. Future studies should test these alternative models to examine if they may reveal different or unique findings from the present study. We encourage readers to fit alternative models to the correlation matrix in Table 3 and examine whether these model provide better fit to our data. We consider our model merely as a plausible first attempt to create a measurement model of well- being that can underpin empirical studies of well-being.
Conclusions
Although the study of happiness has been of great interest to many researchers and the general public, the validity of well-being measures has not improved for the past 50 years (Schneider & Schimmack, 2009). In order for well-being researchers to provide accurate information about the determinants of well-being, it is crucial to use a valid method to assess well-being. If invalid measures are used, findings that rely on such measures will also lack validity. From the current study, we found that only about one third of the variance in a self-report measure of well-being is valid. In order to increase the validity of well-being measures, multiple methods of well-being should be used. When better measures are used, researchers can also be more confident that their findings can be trusted.
References
Andrews, F. M., & Withey, S. B. (1976). Social indicators of well-being: America’s perception of life quality. New York, NY: Plenum.
Anusic, I., Schimmack, U., Pinkus, R. T., & Lockwood, P. (2009). The nature and structure of correlations among Big Five ratings: The halo- alpha-beta model. Journal of Personality and Social Psychology, 97, 1142–1156. doi:10.1037/a0017159
Busseri, M. A., & Sadava, S. W. (2011). A review of the tripartite structure of subjective well-being: Implications for conceptualization, operation- alization, analysis, and synthesis. Personality and Social Psychology Review, 15, 290 –314. doi:10.1177/1088868310391271
Campbell, D. T., & Fiske, D. W. (1959). Convergent and discriminant validation by the multitrait–multimethod matrix. Psychological Bulletin, 56, 81–105. doi:10.1037/h0046016
Cantril, H. (1965). The pattern of human concerns (Vol. 4). New Bruns- wick, NJ: Rutgers University Press.
Cohen, J. (1992). A power primer. Psychological Bulletin, 112, 155–159. doi:10.1037/0033-2909.112.1.155
Diener, E. (1984). Subjective well-being. Psychological Bulletin, 95, 542–
575. doi:10.1037/0033-2909.95.3.542
Diener, E., Emmons, R. A., Larsen, R. J., & Griffin, S. (1985). The Satisfaction With Life Scale. Journal of Personality Assessment, 49, 71–75. doi:10.1207/s15327752jpa4901_13
Diener, E., Lucas, R. E., Schimmack, U., & Helliwell, J. F. (2009). Well-being for public policy. New York, NY: Oxford University Press. doi:10.1093/acprof:oso/9780195334074.001.0001
Diener, E., Lucas, R. E., & Scollon, C. N. (2006). Beyond the hedonic treadmill: Revising the adaptation theory of well-being. American Psy- chologist, 61, 305–314.
Diener, E., Smith, H., & Fujita, F. (1995). The personality structure of affect. Journal of Personality and Social Psychology, 69, 130 –141. doi:10.1037/0022-3514.69.1.130
Diener, E., Suh, E. M., Lucas, R. E., & Smith, H. L. (1999). Subjective well-being: Three decades of progress. Psychological Bulletin, 125, 276 –302. Funder, D. C., Kolar, D. C., & Blackman, M. C. (1995). Agreement among judges of personality: Interpersonal-relations, similarity, and acquain- tanceship. Journal of Personality and Social Psychology, 69, 656 – 672. doi:10.1037/0022-3514.69.4.656
Funder, D. C., Kolar, D. C., & Blackman, M. C. (1995). Agreement among judges of personality: Interpersonal-relations, similarity, and acquain- tanceship. Journal of Personality and Social Psychology, 69, 656 – 672. doi:10.1037/0022-3514.69.4.656
Gere, J., & Schimmack, U. (2011). A multi-occasion multi-rater model of affective dispositions and affective well-being. Journal of Happiness Studies, 12, 931–945. doi:10.1007/s10902-010-9237-3
Kahneman, D., Krueger, A. B., Schkade, D., Schwarz, N., & Stone, A. A. (2006). Would you be happier if you were richer? A focusing illusion. Science, 312, 1908 –1910. doi:10.1126/science.1129688
Kim, H., Schimmack, U., & Oishi, S. (2012). Cultural differences in self- and other-evaluations of well-being: A study of European and Asian Canadians. Journal of Personality and Social Psychology, 102, 856 – 873. doi:10.1037/a0026803
Kolar, D. W., Funder, D. C., & Colvin, C. R. (1996). Comparing the accuracy of personality judgments by the self and knowledgeable others. Journal of Personality, 64, 311–337. doi:10.1111/j.1467-6494.1996
Lucas, R. E., Diener, E., & Suh, E. (1996). Discriminant validity of well-being measures. Journal of Personality and Social Psychology, 71, 616 – 628. doi:10.1037/0022-3514.71.3.616
Lucas, R. E., & Schimmack, U. (2009). Income and well-being. How big is the gap between the rich and the poor? Journal of Research in Personality, 43, 75–78. doi:10.1016/j.jrp.2008.09.004
Muthén, L. K., & Muthén, B. O. (2007). Mplus user’s guide (5th ed.). Los Angeles, CA: Muthén & Muthén.
Oishi, S. (2006). The concept of life satisfaction across cultures: An IRT analysis. Journal of Research in Personality, 40, 411– 423. doi:10.1016/ j.jrp.2005.02.002
Raftery, A. E. (1995). Bayesian model selection in social research. Soci- ological Methodology, 25, 111–164. doi:10.2307/271063
Schermelleh-Engel, K., Moosbrugger, H., & Muller, H. (2003). Evaluating the fit of structural equation models: Tests of significance and descrip- tive goodness-of-fit measures. Methods of Psychological Research, 8, 23–74.
Schimmack, U. (2010). What multi-method data tell us about construct validity. European Journal of Personality, 24, 241–257. doi:10.1002/ per.771
Schimmack, U., Diener, E., & Oishi, S.
(2002). Life-satisfaction is a momentary judgement and a stable personality
characteristic: The use of chronically accessible and stable sources. Journal of Personality, 70, 345–384. doi:10.1111/1467-6494.05008
Schimmack, U., & Oishi, S. (2005). The influence of chronically and temporarily accessible information on life satisfaction judgments. Jour- nal of Personality and Social Psychology, 89, 395– 406. doi:10.1037/ 0022-3514.89.3.395
Schimmack, U., Radhakrishnan, P., Oishi, S., Dzokoto, V., & Ahadi, S. (2002). Culture, personality, and subjective well-being: Integrating pro- cess models of life satisfaction. Journal of Personality and Social Psychology, 82, 582–593.
Schimmack, U., Schupp, J., & Wagner, G. G. (2008). The influence of environment and personality on the affective and cognitive component of subjective well-being. Social Indicators Research, 89, 41– 60. doi: 10.1007/s11205-007-9230-3
Schmidt, F. L., & Hunter, J. E. (1996). Measurement error in psychological research: Lessons from 26 research scenarios. Psychological Methods, 1, 199 –223. doi:10.1037/1082-989X.1.2.199
Schneider, L., & Schimmack, U. (2009). Self-informant agreement in well-being ratings: A meta-analysis. Social Indicators Research, 94, 363–376. doi:10.1007/s11205-009-9440-y
Schneider, L., & Schimmack, U. (2010). Examining sources of self- informant agreement in life-satisfaction judgments. Journal of Research in Personality, 44, 207–212. doi:10.1016/j.jrp.2010.01.004
Schwarz, N., & Strack, F. (1999). Reports of subjective well-being: Judg- mental processes and their methodological implications. In D. Kahne- man, E. Diener, & N. Schwarz (Eds.), Well-being: The foundations of hedonic psychology (pp. 61– 84). New York, NY: Russell-Sage.
Suh, E., Diener, E.,Oishi, S., & Triandis, H. C. (1998). The shifting basis of life satisfaction judgments across cultures: Emotions versus norms. Journal of Personality and Social Psychology, 74, 482– 493.
Sumner, L. W. (1996). Welfare, happiness, and ethics. New York, NY: Oxford University Press.
Veenhoven, R., & Jonkers, T. (1984). Conditions of happiness (Vol. 2). Dordrecht, the Netherlands: Reidel.
Walker, S. S., & Schimmack, U. (2008). Validity of a happiness implicit association test as a measure of subjective well-being. Journal of Re- search in Personality, 42, 490 – 497. doi:10.1016/j.jrp.2007.07.005
1 thought on “The Validity of Well-Being Measures: A Multiple-Indicator–Multiple-Rater Model”