
Authors: Ulrich Schimmack & Jerry Brunner
Since 2011, psychologist no longer know whether they should trust published results. The crisis of confidence was triggered by Bem’s successful demonstration that extraverts have extrasensory abilities to feel random future events. Although evidence of individual studies was weak, the combined evidence of 9 studies provided strong evidence against the common-sense null-hypothesis that causality cannot be time-reversed.
The response to Bem’s (2011) incredible claims was swift. Two articles pointed out that Bem used questionable research practices to produce significant results (Francis, 2012; Schimmack, 2012). Two other articles failed to replicate his results in replication attempts without the help of QRPs (Galak, LeBoeuf, Nelson, & Simmons, 2012; Ritchie, Wiseman, French, 2012).
John, Loewenstein, and Prelec (2012) found that many psychologists assumed that the use of questionable research practices was acceptable and admitted to using them in their own research. As a result, it is now unclear which published results in psychology journals can be trusted.
To provide much needed empirical information about the replicability of published findings, Brian Nosek initiated a series of replication studies. The vast majority of these studies replicated experimental studies in social psychology. The most important finding was that replications of a representative sample of studies in social psychology produced only 25% statistically significant results (Open Science Collaboration, 2015). This shocking result has dramatic implications for the credibility of social psychology as a science.
A simple prediction rule would be to bet on the high base rate of replication failures. With a success rate of only 25%, this prediction rule would be correct 75% of the time. The aim of this article is to present a statistical model that is superior to the base-rate rule.
A better prediction model is also needed for cognitive psychology, where the success rate of replication studies was 50%. With success rates around 50%, base rates are not very informative.
A statistical prediction model would be very useful because there have been few systematic replication projects in other disciplines of psychology, where studies are more costly (e.g., infant studies, fMRI studies, longitudinal studies, etc.).
A Statistical Prediction Model
Brunner and Schimmack (2018) developed a statistical model that can predict the success rate of a set of replication studies on the basis of the test statistics in original research articles. The model works because the success rate of exact replication studies is equivalent to the mean statistical power of the original studies. The only challenge is to estimate mean power based on test statistics with heterogeneity in sample sizes and effect sizes after selection for significance. Brunner and Schimmack (2018) demonstrated with simulation studies that their method, z-curve, provides good estimates of mean power.
One goal of this article is to compare z-curve predictions with the observed success rates in social psychology and cognitive psychology. However, a more important goal is to develop better prediction rules that are able to distinguish studies with low power and studies with high power within a set of studies.
To make more refined predictions of replicability, we use the concept of local power, which is akin to Efron’s (2015) local false discovery rates. If studies are heterogeneous in sample size and effect size, they also vary in power. As sampling error simply adds random noise to the non-centrality parameters of each study, studies with higher observed z-scores are more likely to have higher power. As a result, we can postulate a monotonic relationship between observed power and true power. Thus, it is possible to provide local power estimates for segments of observed z-scores. The overall estimate of mean power is simply a weighted average of local power estimates that takes the percentage of observations for each local region into account.
To illustrate the concept of local power, imagine a simple scenario where studies have only one of three true power values: 20%, 50%, and 80%. Further, assume that 50% of studies have 20% power, 30% of studies have 50% power, and 20% of studies have 80% power. The overall mean power for this simple example equals .5*20 + .3*50 + .2*80 = 41%.
Figure 1 shows the corresponding density distribution of the mixture model. The black area shows the contribution of the low powered studies to the total density. The red area shows the contribution of the moderately powered studies and the blue area shows the contribution of the high powered studies.
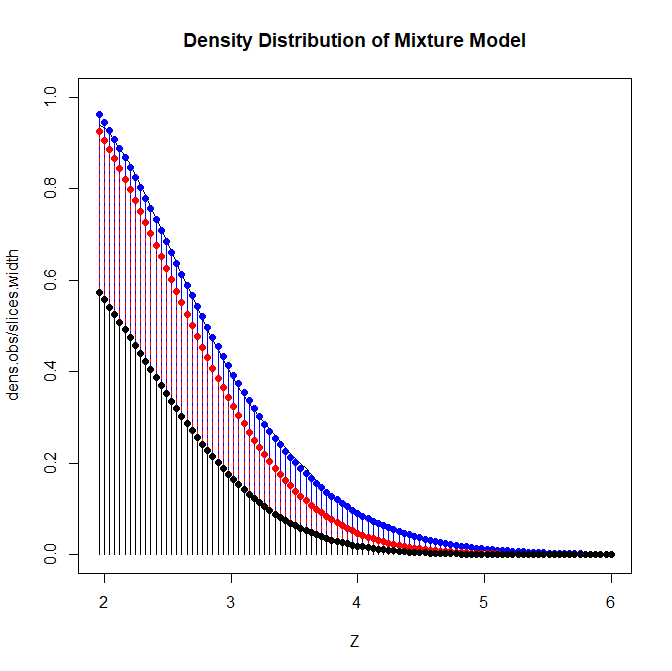
For a low z-score of 2, it is readily apparent that most of the density stems from the low powered followed by the medium powered studies, and very few high powered studies. As z-scores increase the relative contribution shifts until the density is dominated by the high powered studies for z-scores greater than 4.5. For each z-score, it is possible to compute a weighted average of the true powers. The total mean power is the average of all slices. More important, the local power is the weighted average of the slices for a specific region.
To obtain local estimates of mean power (local power), it is possible to average mean power of slices for regions of z-scores (e.g., 2 to 2.5). Figure 2 shows the results of a z-curve analysis with local power estimates (Z.Curve Version 19.1).

The model is estimated using only significant z-scores although the simulated non-significant results that would normally be in the proverbial file-drawer are also shown. The grey line shows the fit of the model to the data. The model also makes projections about the shape of the file drawer based on the distribution of significant z-scores. More important, below the x-axis are the local power estimates in intervals of .5 standard deviations. Consistent with the simulation, power starts with 20% on the left side because most of the left-most observations represent studies with 20% power. As z-scores increase on the x-axis, mean power is increasingly a mixture of all three power levels and mean power gradually increases. For extremely high z-scores most of the few observations are from the set with 80% power. Thus, the mean power approaches 80%.
Figure 2 shows that just significant p-values with p-values between .01 and .05 (~ 2 > z < 2.5) have only a mean power of 35%. Thus, exact replication studies are more likely to produce a non-significant result than a significant result. For optimal prediction of replication outcomes, betting on success makes only sense when mean power is greater than 50%. For these simulated data, this level is achieved with z-scores greater than 3.5.
The observed z-score at which mean power is greater than 50% depends on the power distribution of all studies. If all studies had 50% power, even non-significant results would have probability of 50% to be significant.
By fitting z-curve to observed test-statistics of original studies, it is possible to create optimal prediction rules depending on the power of studies in a particular field. We validated these predictions against the results of actual replication studies in social psychology and cognitive psychology.
Application to Social Psychology
To have the largest set of credible replication studies, we used the Curate Science database. Curate Science includes all major replication projects and individual replication efforts. It currently contains over 180 original studies that have been replicated. 130 studies were social studies and 126 reported a significant result with a usable test statistic.
Figure 3 shows the success rates as a function of the observed z-scores.
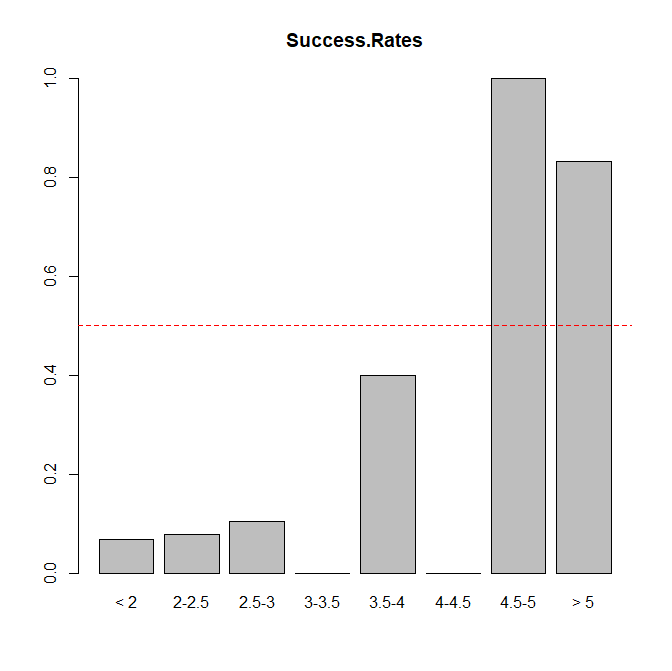
As can be seen, it requires z-scores greater than 4.5 to break the 50% barrier. A simple “don’t believe anything” rule would make 108 correct predictions and 16 false predictions (83% success rate). A rule that predicts failure for z-scores below 4.5 and success for z-scores greater than 4.5 makes 112 correct predictions and 12 false predictions (86% success rate). Although this is not a statistically significant difference, given the small set of actual replication studies, the evidence suggests that a rule that predicts successes with z-scores greater than 4.5 is superior.
Next, we fitted z-curve to the test-statistics of the original studies. Test-statistics were first converted into p-values and p-values were then converted into z-scores.

Figure 4 shows the mean power estimates for the significant studies as replication rate. If these studies could be replicated exactly, we would expect 35% significant results in the replication studies. The graph also shows the estimated size of the file-drawer of studies that are required to produce the published significant results. The file-drawer ratio suggests that for every published study there are about 4 unpublished results with non-significant results. This estimate assumes that no other questionable research practices were used. Most important, the local power estimates show that just significant results have low power of 26% for z-scores between 2 and 2.5 and 32% for z-scores between 2.5 and 3. The actual replication rates for studies with z-scores in this range are even lower. Studies with z-scores between 3.5 and 4 are estimated to have 49% power, compared to an actual success rate of 40%. For studies with z-scores greater than 4, the success rates are above 50%. Given the small sample size, all of these estimates are imprecise, but the results are encouraging. The z-curve model also suggests that z-scores of 4 or higher are needed to achieve 50% mean power.
Taken together, these results provide first evidence that z-curve can be used to develop prediction rules that take the amount of selection in a literature into account. For social psychology, most replication attempts were failures. Given the high base-rate of failures, it is difficult to find predictors of success. These analyses suggest that original results are likely to replicate if the test statistic corresponds to a z-score of 4 or p < .0001.
The main advantage of z-curve over actual replication studies is that it is possible to apply z-curve to a representative sample of studies in social psychology. This makes it possible to create a rule that is not biased by the selection criteria for studies that were actually replicated (e.g., an oversampling of ego-depletion and priming studies).
Motyl et al. (2016) coded a representative sample of studies from three social psychology journals (JESP, PSPB, JPSP). Applying z-curve to their dataset produces a similar estimate of the predicted replication rate. It also showed that studies with just significant results have very low power. However, local power estimates suggested that results with z-scores greater than 3.5 rather than 4 have more than 50% mean power. As this estimate is based on a larger and more representative sample, the prediction rule might be adjusted accordingly. However, validation with actual replication studies is needed to verify this rule.

Application to Cognitive Psychology
The Curate Science database included 49 cognitive studies. The replication success rate for cognitive studies was considerably higher than for social psychology (57%). More important, the success rates for different levels of evidence were above 50% for z-scores greater than 3; rather than 4 for social psychology.
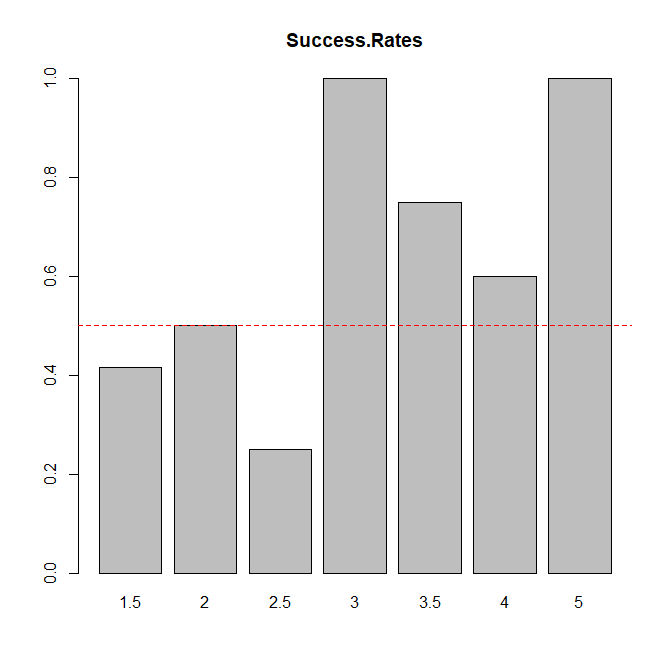
Given the overall success rate of 57%, the base-rate rule would predict successes for all studies and would be correct 57% of the time. Using a rule that bets on success only for z > 3 and on failure for z < 3 is correct 60% of the time. Given the small sample of studies, this is not a significant improvement.

The z-curve analysis is consistent with the actual replication results. The predicted success based on test statistics in the original studies is 61% vs. 57% in actual studies. The file drawer of unreported non-significant results is much smaller than in social psychology. Local power estimates are just below 50% for z-scores ranging from 2 to 3, but are above 50% for z-scores above 3. This confirms that the most optimal prediction rule for cognitive psychology is to bet on studies with a z-score greater than 3 or a p-value less than .001.
It would be desirable to compare this estimate against a larger, representative set of cognitive studies. We are currently working on such a project. Here we can report preliminary results based on studies published in the Journal of Experimental Psychology: Learning, Memory, and Cognition. So far, 153 studies have been coded.

The results based on a representative sample of studies that is three times larger than the sample of studies with actual replication studies are similar to the results for the Curate Science sample. On average, the model predicts 55% successful replications. The rate of successes is below 50% for studies with z-scores less than 3 and above 50% for studies with z-scores above 3.
Discussion
In this article, we introduced z-curve as a prediction model for replication outcomes in social and cognitive psychology. Z-curve is based on the deterministic relationship between statistical power and replicability. If it were possible to replicate studies exactly, the success rate in a set of exact replication studies equals the mean power of the original studies. Z-curve is able to estimate mean power based on the reported test statistics in original studies (Brunner & Schimmack, 2018). We found that z-curve overestimates success rates in social psychology (35% vs. 13%), whereas predictions for cognitive psychology were close to the actual success rate (61% vs. 57%). We also introduced local power and provided mean power estimates for different levels of evidence. For social psychology, the success rates were above 50% only for z-scores greater than 4.5. Z-curve produced estimates of mean power greater than 50% for z-scores greater than 4. For cognitive psychology, mean success rates were above 50% starting with z-scores of 3. Z-curve also obtained mean power estimates greater than 50% for z-scores greater than 3. Similar results were obtained in two independent and representative samples of studies in social and cognitive psychology. Overall, these results suggests that z-curve is a valuable tool to examine the replicability of published results on the basis of the published test results. The statistical approach of examining replicability complements attempts to examine replicability of published results with actual replication studies, but it has several advantages. The main advantage is that it is much easier to examine the replicability of a large and representative set of studies. As revealed in the curate science database, so far social psychological studies that are easy to carry out have been the focus of replication attempts. Hardly anything is known about the replicability of research in other areas of psychology. Z-curve can be applied to a representative sample of studies across all disciplines in psychology to estimate the replicabilty in psychology. It can also be used to compare disciplines or to examine changes in replicability over time. Our results also have implications for some hotly debated issues in meta-psychology.
What explains replication failures in social psychology?
The success rate of replication attempts in social psychology is abysmal. Social psychologists have many ignored this evidence and blamed problems with the replication studies for this unflattering outcome. For example, Gilovich et al. (2019) write in a textbook for undergraduate students that many of the attempted replication studies in the OSC (2015) project were so poorly designed that “they weren’t replications at all.” Another criticism was that the replication studies were inconclusive because they were underpowered (Gilbert et al., 2016). The present results show that the replication studies were underpowered because the replicated underpowered original studies. Moreover, the results show that poorly designed replication studies may account for the discrepancy between 13% and 38%, but not for the discrepancy between 100% successes of published studies and 38% mean power to produce these successes. This discrepancy reveals that the high success rate in social psychology is only obtained with the use of questionable research practices that inflate the type-I error risk. As a result, the implicit claim that at most 5% of published results are false positives is misleading (Sterling, 1959). The actual risk of a false positive result is much higher than 5%.
The ability to estimate replicability based on original results makes it possible to resolve controversies about replication failures. If studies have low power, replication failures are too be expected, even if the replication study is a perfect replica of the original study. However, in social psychology it is often difficult to replicate studies exactly. Thus, the probability that an actual replication study is successful is even lower. As a result, it is paramount for social psychologists to increase the power of their studies to have a realistic chance to publish results that generalize across different experimental contexts and populations.
The positive contribution of z-curve is the ability to isolate subsets of studies that produce replicable resuls. One way to do so is to focus on the strength of evidence. Questionable research practices are more likely to produce just significant results with z-scores less than 3. As a result, studies with stronger evidence are more likely to replicate. Based on z-curve analysis, studies with z-scores greater than 3.5 or 4 have at least a mean power of 50% and are unlikely to be false positives. Future research should build on these studies to develop an empirical foundation for social psychological theories.
The Alpha Wars
Benjamin and co-authors argued that psychological science is in a crisis because the standard criterion for rejecting the null-hypothesis of alpha = .05 is too liberal. They propose alpha = .005 as a better criterion. The main problem with their critique is the Fisherian focus on type-I errors. A balanced assessment of research practices needs to take type-II errors into account. Type-II errors are often ignored because they depend on the unknown population effect sizes. Z-curve overcomes this problem by providing estimates of mean power without requiring knowledge about the distribution of population effect sizes.
The results presented here suggest that the biggest problem in psychological science are unacceptably high type-II errors rather than a liberal standard for type-I errors. With 40% power for social psychology, the average type-II error is 60% (beta = 1-power). This means, the risk of a type-II error is .60/.05 = 12 times greater than the risk of a type-I error. Cohen (1988) suggested that a ratio of 4:1 (20% type-II error vs. 5% type-I error) is reasonable. Accordingly, social psychologists would have to double power or increase alpha from .05 to .15. Lowering alpha to .005 would create an imbalanced ratio of 120 to 1 between type-II and type-I errors. Given the current level of resources, lowering type-I errors will only increase the risk of type-II errors.
Another problem of Benjamin et al.’s recommendation is that the authors ignore the influence of questionable research practices. Questionable research practices inflate the type-I error risk. Thus, published results that claim p < .05 are not justified as long as questionable research practices are used. Cracking down on the use of questionable research practices and increasing power would yield fewer just significant results that would have a higher probability of successful replication.
Cognitive psychology shows that it is unnecessary to lower alpha because studies have higher power. As a result, there are fewer just significant results and more of these were obtained with relatively high power. Cognitive psychology has not encountered stunning replication failures like social psychology. Lowering alpha for cognitive psychology would be a waste of resources. The present results suggest that cognitive psychology could benefit from doubling sample sizes in within-subject, repeated measurement studies from 25 to 50 to increase power to 80%. This alone would produce more just significant results with alpha = .05 with good replication rates.
Benjamin et al.’s article is a recommendation for future studies. They do not discuss how researchers should interpret already published results. One could interpret their article as suggesting that alpha = .005 could also be applied to published articles. However, we think a better approach is to estimate replicability and to base decisions about the strength of evidence on type-II error risk rather than type-I error risk. Studies with mean power of 50% or more are unlikely to contain many false positive results and are likely to replicate in future studies. Zcurve can be used to find studies with mean power that exceeds a minim standard of 50% or meets a higher standard such as Cohen’s 80% criterion. Using this criterion, we would only consider social studies with z-scores greater than 4 as significant results, while the standard for cognitive psychology is a z-score greater than 3. Future research can develop standards for other disciplines or areas of research.
Conclusion
We demonstrated how zcurve can be used to predict outcomes of replication studies and how this information can be used to develop rational decision rules that distinguish between studies that are likely to replicate or not. The results show that social psychology has a replication crisis because many results were obtained with low statistical power and the help of questionable research practices. In contrast, cognitive psychology is faring relatively well, although a success rate that is just above 50% is not ideal. Cognitive psychologists would also benefit from increasing power in their studies to publish more replicable results. We believe that z-curve is a promising tool to examine the replicability of other disciplines in psychology and other sciences that use inferential statistics. Z-curve can also be used to evaluate the effectiveness of open science initiatives to improve psychological science. In short, z-curve is awesome; at least, we think so.
2 thoughts on “A Prediction Model of Replication Outcomes in Social and Cognitive Psychology”