
“These responses to our work have also furnished us moments of delicious irony, in that each critique makes the basic claim that our account of the data displays an incompetence that we somehow were ignorant of.” (Dunning, 2011, p. 247).
In 1999, Kruger and Dunning published an influential article. With 2258 citations in WebofScience it ranks #28 in citations for articles in the Journal of Personality and Social Psychology. The main contributions of the article were (a) to demonstrate that overestimation of performance is not equally distributed across different levels of performance, and (b) to provide a theory that explain why low-performers are especially prone to overestimate their performance. The finding that low-performers overestimate their performance, while high-performers are more accurate or even underestimate their performance has been dubbed the Dunning-Kruger effect (DKE). It is one of the few effects in social psychology that is named in honor of the researchers who discovered it.
The effect is robust and has been replicated in hundreds of studies (Khalid, 2016; Pennycook et al., 2017). Interestingly, it can even be observed with judgments about physical attributes like attractiveness (Greitemeyer, 2020).
While there is general consensus that the DKE is a robust phenomenon, researchers disagree about the explanation for the DKE. Kruger and Dunning (1999) proposed a meta-cognitive theory. Accordingly, individuals have no introspective access to their shortcomings. For example, a student who picked one answer from a set of options in a multiple-choice test thinks that they picked the most reasonable option. After all, they would have picked a different option if they had considered another option as more reasonable. Students only become aware that they picked the wrong option when they are given feedback about their performance. As a result, they are overly confident that they picked the right answer before they are given feedback. This mistake will occur more frequently for low-performers than for high performers. It can not occur for students who ace their exam (i.e, get all answers correct). The only mistake top-performers could make is to doubt their right answers and underestimate their performance. Thus, lack of insight into mistakes coupled with a high frequency of mistakes leads to higher overconfidence among low-performers.
In contrast, critiques of the meta-cognitive theory have argued that DKE is a statistical necessity. As long as individuals are not perfectly aware of their actual performance, low-performers are bound to overestimate their performance and high-performers are bound to underestimate their performance (Ackermann et al., 2002; Gignac & Zajenkowski, 2020; Krueger & Mueller, 2002). This account has been called regression to the mean. Unfortunately, this label has produced a lot of confusion because the statistical phenomenon of regression to the mean is poorly understood by many psychologists.
Misunderstanding of Regression to the Mean
Wikipedia explains that “in statistics, regression toward the mean (or regression to the mean) is the phenomenon that arises if a sample point of a random variable is extreme (nearly an outlier), a future point will be closer to the mean or average on further measurements.”
Wikipedia also provides a familiar example.
Consider a simple example: a class of students takes a 100-item true/false test on a subject. Suppose that all students choose randomly on all questions. Then, each student’s score would be a realization of one of a set of independent and identically distributed random variables, with an expected mean of 50. Naturally, some students will score substantially above 50 and some substantially below 50 just by chance. If one selects only the top scoring 10% of the students and gives them a second test on which they again choose randomly on all items, the mean score would again be expected to be close to 50. Thus the mean of these students would “regress” all the way back to the mean of all students who took the original test. No matter what a student scores on the original test, the best prediction of their score on the second test is 50.
This is probably the context that most psychologists have in mind when they think about regression to the mean. The same measurement procedure is repeated twice. In this scenario, students who performed lower the first time are likely to increase their performance the second time and students who performed well the first time are bound to decrease in their performance the second time. How much students regress towards the mean depends on the influence of their actual abilities on performance on the two tests. The more strongly the two tests are correlated, the less regression to the mean occurs. In the extreme case, where performance is fully determined by ability, the retest correlation is 1 and there is no regression to the mean because there are no residuals (i.e., deviations of individuals between their two performances).
The focus on the specific example of repeated measurements created a lot of confusion in the DKE literature. It probably started with Krueger and Mueller’s critique. First, they emphasize statistical regression and even provide a formula that shows a deterministic relationship between a predictor variable x and the discrepancies between the predictor variable and criterion, r(x,x-y) that is bound to be negative. It follows that low performers are bound to have larger positive deviations. However, they then proceed to discuss reliability of the performance measures.
Thus far, we have assumed that actual percentiles are perfectly reliable measures of ability. As in any psychometric test, however, the present test scores involved both true variance and error
variance (Feldt & Brennan, 1989). With repeated testing, high and low test scores regress toward the group average, and the magnitude of these regression effects is proportional to the size of the error variance and the extremity of the initial score (Campbell & Kenny, 1999). In the Kruger and Dunning (1999) paradigm, unreliable actual percentiles mean that the poorest performers are not as deficient as they seem and that the highest performers are not as able as they seem.
This passage implies that regression to the mean plays a different role in the DKE. Performance on any particular test is not only a function of ability, but also (random) situational factors. This means that performance scores are biased estimates of ability. Low performers’ scores are more likely to be biased in a negative direction than high performers. If performance judgments are based on self-knowledge of ability, the comparison of judgments with performance scores is biased and may show an illusory DKE. To address this problem, Krueger and Mueller propose to estimate the reliability of test scores and to correct for the bias introduced by unreliability.
In the following 18 years, it has been neglected that Krueger and Mueller made two independent arguments against the meta-cognitive theory. One minor problem is unreliability in the performance measure as a measure of ability. The major problem is that the DKE effect is a statistical necessity that applies to difference scores.
Unreliability in the Performance Measure Does not Explain the DKE
Kruger and Dunning (2002) responded to Krueger and Mueller’s (2002) critique. Their response focused exclusively on the problem of unreliable performance measures.
“They found that correcting for test unreliability reduces or eliminates the apparent asymmetry in calibration between top and bottom performers.” (p. 189).
They then conflate statistical regression and unreliability when they ask “Does regression explain the results?”
The central point of Krueger and Mueller’s (2002) critique is that a regression artifact, coupled with a general BTA effect, can explain the results of Kruger and Dunning (1999). As they noted,
all psychometric tests involve error variance, thus “with repeated testing, high and low test scores regress toward the group average, and the magnitude of these regression effects is proportional to the size of the error variance and the extremity of the initial score” (Krueger & Mueller, 2002, p. 184). They go on to point out that “in the Kruger and Dunning (1999) paradigm, unreliable actual percentiles mean that the poorest performers are not as deficient as they seem and that the highest performers are not as able as they seem” (p. 184). Although we agree that test unreliability can contribute to the apparent miscalibration of top and bottom performers, it cannot fully explain this miscalibration” (p. 189)
This argument has convinced many researchers in this area that the key problem is unreliability in the performance measure and that this issue can be addressed empirically by controlling for unreliability. Doing so, typically does not remove the DKE (Ehrlinger, Johnson, Banner, Dunning, & Kruger, 2008).

The problem is that unreliability in the performance measure is not the major concern. It is not even clear how it applies when participants are asked to estimate their performance on a specific test. A test is an unreliable measure of an unobserved construct like ability, but a student who got 60% of multiple choice question correct got 60% of the question correct. There is no unreliability in manifest scores.
The confusion between these two issues has led to the false impression that the regression explanation has been examined and empirically falsified as a sufficient explanation of DKE. For example, in a review paper Dunning (2011) wrote.
Fortunately, there are ways to estimate the degree of measurement unreliability and then correct for it. One can then assess what the relation is between perception and reality once unreliability in measuring actual performance has been eliminated. See Fig. 5.3, which displays students’ estimates of exam performance, in both percentile and raw terms, for a different college class (Ehrlinger et al., 2008, Study 1). As can be seen in the figure, correcting for measurement unreliability has only a negligible impact on the degree to which bottom performers overestimate their performance (see also Kruger & Dunning, 2002). The phenomenon remains largely intact. (p. 266).
The Dunning-Kruger Effect is a Statistical Necessity
Another article in 2002 also made the point that DKE is a statistical necessity, although the authors called it an artifact (Ackerman et al., 2002). The authors made their point with a simple simulation.
To understand whether this effect could be accounted for by regression to the mean, we simulated this analysis using two random variables (one representing objective knowledge and the other self-reported knowledge) and 500 observations (representing an N of 500). As in the Kruger and Dunning (1999) comparison, these random variables were correlated r=0.19. The observations were then divided into quartiles based on the simulated scores for the objective knowledge variable (n=125 observations per quartile). Simulated self-report and objective knowledge were then compared by quartile. As can be seen in Fig. 1, the plotting of simulated data for 500 subjects resulted in exactly the same phenomenon reported by Kruger and Dunning (1999)—an overestimation for those in the lowest quartile and an underestimation for those in the top quartile. Further analysis comparing the means of self-report and objective knowledge for each quartile revealed that the difference between the simulated self-reported (M=-0.21) and objective (M=-1.22) scores for the bottom quartile was significant t (124)= -10.09, P<0.001 (which would be ‘‘interpreted’’ as overestimation of performance). The difference between simulated self-reported (M=0.27) and objective (M=1.36) scores for the top quartile was also significant, t(124)=11.09, P<0.001, (‘‘interpreted’’ as underestimation by top performers). This illustration demonstrates the measurement problems associated with interpreting statistical significance when two variables are compared across groups selected for performance on one of the variables, and there is a low correlation between the two variables.

Unaware of Ackerman et al.’s (2002) article, Gignac & Zajenkowski (2020) used simulations to make the same point.
Here is an R-Script to perform the same simulation.
N = 500
accuracy = .6
obj = rnorm(N)
sub = objaccuracy + rnorm(N)sqrt(1-accuracy^2)
summary(sub)
plot(obj,sub,xlim=c(-3,3),ylim=c(-3,3),
xlab=”Performance”,ylab=”Estimates”
)
abline(h = 0)
quarts = quantile(obj,c(0,.25,.5,.75,1))
abline(v = quarts,lty=2)
quarts
x = tapply(obj,cut(obj,quarts),mean)
y = tapply(sub,cut(obj,quarts),mean)
x
y
par(new=TRUE)
plot(x,x,pch=19,cex=2,xlim=c(-3,3),ylim=c(-3,3),col=”blue”,
xlab=”Performance”,ylab=”Estimates”
)
par(new=TRUE)
plot(x,y,pch=15,cex=2,xlim=c(-3,3),ylim=c(-3,3),col=”blue”,
xlab=”Performance”,ylab=”Estimates”
)
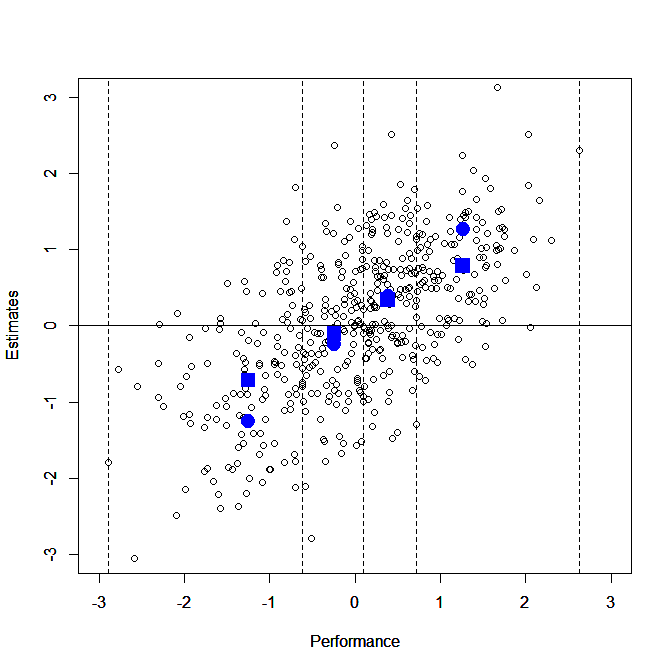
It is reassuring that empirical studies mostly found support for a pattern that is predicted by a purely mathematical relationship. However, it is not clear that we need a term for it and naming it the Dunning-Kruger effect is misleading because Kruger and Dunning provided a psychological explanation for this statistically determined pattern.
Does the Simulation Provide Ironic Support for the Dunning-Kruger Effect?
Dunning (2011) observed that any valid criticism of the DKE would provide ironic support for the DKE. After all, the authors confidently proposed a false theory of the effect in full ignorance of their incompetence to realize that their graphs reveal a statistic relationship between any two variables rather than a profound insight into humans’ limited self-awareness.
I disagree. The difference is that students after an exam before they get the results have no feedback or other valid information that might help them to make more accurate judgments about their performance. It is a rather different situation when other researchers propose alternative explanations and these explanations are ignored. This is akin to students who come to complain about ambiguous exam questions that other students answered correctly in large numbers. Resistent to valid feedback is not the DKE.
As noted above, Kruger and Dunning (2002) responded to Krueger and Mueller’s criticism and it is possible that they misunderstood Krueger and Mueller’s critique because it did not clearly distinguish between the statistical regression explanation and the unreliability explanation for the effect. However, in 2015 Dunning does cite Ackerman et al.’s article, but claims that the regression explanation has been addressed by controlling for unreliability.
To be sure, these findings and our analysis of them are not without critics. Other researchers have asserted that the Dunning-Kruger pattern of self-error is mere statistical artifact. For example, some researchers have argued that the pattern is simply a regression-to-the-mean effect (Ackerman, Beier, & Bowen, 2002; Burson, Larrick, & Klayman, 2006; Krueger & Mueller,
2002). Simply because of measurement error, perceptions of performance will fail to correlate perfectly with actual performance. This dissociation due to measurement error will cause poor performers to overestimate their performance and top performers to underestimate theirs, the pattern found, for example, in Fig. 1. In response, we have conducted studies in which we
estimate and correct for measurement error, asking what the perception/ reality link would look like if we had perfectly reliable instruments assessing performance and perception. We find that such a procedure reduces our pattern of self-judgment errors only trivially (Ehrlinger et al., 2008; Kruger & Dunning, 2002). (p. 157).
Either Dunning cited, but did not read Ackerman et al.’s article, or he was unable to realize that statistical regression and unreliable measures are two distinct explanations for the DKE.
Does it Matter?
In 2011, Dunning alludes to the fact that there are two distinct regression effects that may explain the DKE.
There are actually two different versions of this “regression effect” account of our data. Some scholars observe that Fig. 5.2 looks like a regression effect, and then claim that this constitutes a complete explanation for the Dunning–Kruger phenomenon. What these critics miss, however, is that just dismissing the Dunning–Kruger effect as a regression effect is not so much explaining the phenomenon as it is merely relabeling it. What one has to do is to go further to elucidate why perception and reality of performance are associated so imperfectly. Why is the relation so regressive? What drives such a disconnect for top and bottom performers between what they think they have achieved and what they actually have? (p. 266)
Here Dunning seems to be aware that unreliability in the performance measure is not necessary for regression to the mean. His response to this criticism is less than satisfactory. The main point of the regression to the mean model is that low-performers are bound to overestimate their performance because they are low performers. No additional explanation is needed other than uncertainty about one’s actual performance. Most important, the regression model assumes that low-performers and high-performers are no different in their meta-cognitive abilities to guess their actual performance. The DKE emerges even if errors are simulated as random noise.
In contrast, Kruger and Dunning’s main claim is that low-performers suffer from two short-comings.
My colleagues and I have laid blame for this lack of self-insight among poor performers on a double-curse—their deficits in expertise cause them not only to make errors but also leave them unable to recognize the flaws in their reasoning. (Dunning, 2011, p. 265).
This review of the main arguments in this debate shows that the key criticism of Kruger and Dunning’s account of their findings has never been seriously addressed. As a result, hundreds of studies have been published as empirical support for an effect that follows from a statistical relationship between two imperfectly correlated variables.
This does not mean that the regression model implies that limited self-awareness is not a problem. The model still implies that low performers are bound to overestimate their performance and high performers are bound to underestimate their performance. The discrepancies between actual and estimated performance are real. The difference is just not due to differences in lack of insight into one’s abilities. Although this may be the case, it is difficult to test the influence of additional factors because regression to the mean alone will always produce the predicted pattern.
It is disconcerting that researchers have spend 20 years on studying a statistical phenomenon as if it provides insights into human’s ability to know themselves. The real question is not why low-performers overestimate their performance more than others. This has to be the case. The real question is why individuals often try to avoid feedback that provides them with more accurate knowledge of themselves. Of course, this question has been addressed in other lines of research on self-verification and positive illusions that rarely connects with the Dunning-Kruger literature. The reason may be that research on these topics is much more difficult and produces more inconsistent results than plotting aggregated difference scores for two variables.