Reference
Chen, L., Benjamin, R., Guo, Y., Lai, A., & Heine, S. J. (2025). Managing the terror of publication bias: A systematic review of the mortality salience hypothesis. Journal of Personality and Social Psychology. Advance online publication. https://dx.doi.org/10.1037/pspa0000438
Introduction
Terror Management Theory was popular during the golden days of experimental social psychology before the replication crisis. A recent meta-analysis uncovered over 800 studies of the hypothesis that subtle reminders of our own mortality shift values (Chen et al., 2025). In the wake of the replication crisis, interest in experimental priming studies with mortality stimuli has decreased.

Chen et al.’s meta-analysis may be the nail in the coffin for terror management theory. The authors used various statistical methods to probe the credibility of this literature. A naive analysis that does not take publication bias and questionable research practices (p-hacking) into account shows a robust effect. However, funnel plots and z-curve shows clear evidence of selection bias; that is the selective reporting of results that support the hypotheses derived from terror management theory. (p-curve did not show evidence for extreme p-hacking, but it is not a sensitive tool to detect p-hacking when studies are heterogeneous in power).
After taking selection bias into account, regressing effect sizes on sampling error showed no evidence of an effect. That is, the intercept was not significantly different from zero. In fact, the intercept was significantly different from zero in the opposite direction, but values close to zero could not be ruled out, Hedges’ g (similar to Cohen’s d) = -.20 to -.03. Thus, this analysis suggests that the typical effect size is close to zero. One limitation of this method is that it assumes a common effect size across studies and does not allow for heterogeneity in effect sizes.
P-curve is similar in that it assumes that all studies have the same power. This is an implausible assumption because variation in sample sizes alone produces variation in power even if all studies have the same effect size (unless the effect size is zero) (Brunner, 2018). However, variation in power could be small especially if effect sizes are small and sampling error is low. This appears to be the case with TMT studies. Power is estimated to be only 25%, with a tight confidence interval ranging from 21% to 29%. This finding suggests that studies have low power, but that there is an effect that can be detected in 1 out of 5 studies. P-curve has three limitations. First, it assumes that all studies have similar power, but it does not test this assumption. Second, it is sensitive to extreme values in some studies that can inflate the estimate of power. Third, confidence intervals are too narrow when the assumption is violated (McShane et al., 2020).
The authors also included an – unplanned – z-curve analysis. A footnote explains that this analysis was added after I posted a z-curve analysis of their open data on twitter. (p. 14)
The z-curve analysis produced a similar estimate of average power of the significant results (only significant results were included in the analysis) than p-curve, .19, 95%CI =..13 to .26. The authors report a lower estimate for the unconditional power before selection for significance. This estimate is based on a selection model that assumes selection is a random process and studies with high power are more likely to be selected because they are more likely to produce significant results. This implies heterogeneity in power so that studies with higher power are more likely to be among the significant results. According to this model, there are many studies with non-significant results and lower power that were not reported. The estimated average power for all studies was .08, 95%CI = .05 to .17.
I reproduced the results here, EDR = 11%, 95%CI = 5% to 21%, using the Kernel Density approach rather than the EM algorithm that is the default in the z-curve R-package.

In both analysis the lower limit of the unconditional power estimate (i.e., the Expected Discovery Rate, EDR) is 5%. Chen et al. (2025) do not mention the implications of result. A long-run rate of 5% significant results is expected by chance alone without a real effect size. This implies that all of the significant results could be false positive results. For EDR values above 5%, it is still possible to estimate the maximum rate of false positive results, using a formula by Soric (1989). Figure 1 shows that the FDR point estimate is 43%, but that the 95%CI is wide and ranges from 20% to 100%. It is therefore not possible to conclude that most results in this literature ARE false positive results. However, it is also not possible to rule out that most results COULD BE false positives. The main point of data collection is to provide evidence against a false null-hypothesis. Z-curve suggests that even 826 published significant results do not provide evidence to reject the null-hypothesis that mortality salience manipulations influence behavior. In short, z-curve results agree with the regression results that it is not possible to reject the null-hypothesis.
At the same time, the z-curve analysis suggests that studies are heterogeneous and that studies with significant results have an average power of at least 12%, which implies that some studies produced real effects that could be replicated. Figure 1 shows this heterogeneity with estimates of local power below the x-axis. This feature is not yet implemented in the z-curve package. Studies with z-scores below 2 have low power (6-11%). Studies with significant results and weak evidence (z = 2-4) still have low power (13% to 48%), but studies with z-scores greater than 4 have power estimates of 77% or more. This suggests that these studies could produce significant results in replication studies. However, local power estimates are noisy and rely on the assumption that power really varies across studies.
To test whether power varies across studies, I fitted a z-curve with a single parameter that estimates the non-central z-value that is most compatible with the data. Again, this model is not yet implemented in the r-package. To compare the heterogeneous and the homogenous models, I conducted bootstrapped analysis and recorded the 83%confidence intervals. The confidence intervals overlapped, homogeneous model: RMSE = .041 to .065, heterogeneous model: RMSEA = .030 to .057. This means that we cannot reject the null-hypothesis of equal power at the .05 level.
Figure 2 shows the estimates for the homogenous model. According to this model, all studies with z-scores below 6 have 12% power. The estimated EDR is 14% because 15 studies have z-scores greater than 6. The ERR is 13% for the same reason. The ERR is lower than the EDR because the ERR takes the sign of significance into account. Only studies that produce a significant result with the same sign are considered successful replications.
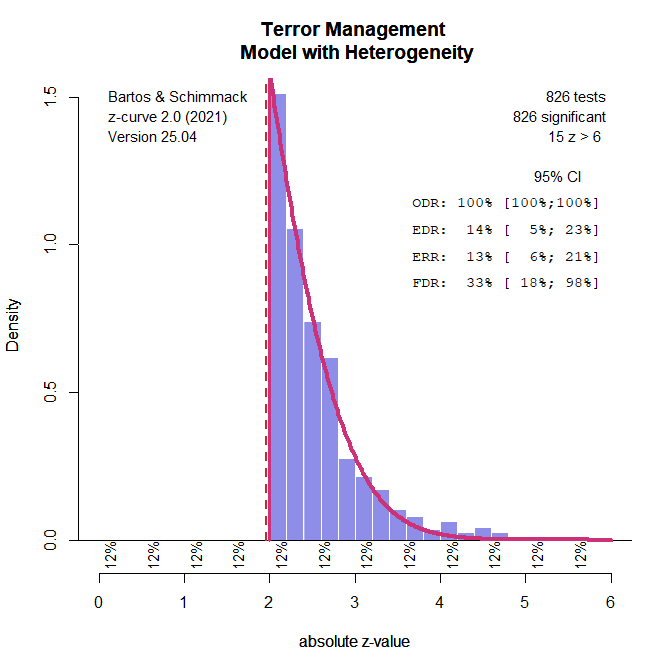
In this scenario, the FDR estimate is not meaningful because it implies a mixture of true and false hypotheses, whereas the homogeneous model assumes that all studies have the same power. Accordingly, the null-hypothesis is false in all studies, but the studies are all underpowered and the effect size estimates in all studies are inflated because significance can only be obtained with inflated effect size estimates.
While defenders of terror management theory may cheer about the finding that the data are consistent with a homogenous model and a rejection of the null-hypothesis, critics may look at the lack of heterogeneity differently. The alternative explanation is that the true effect size is negligible in all studies and that there are no moderators that produce stronger effects in some studies. According to this interpretation, the entire literature has produced no credible results that tell us anything about people’s response to reminders of their own mortality. In short, it is all BS. Based on these results, it is not clear which study provides any foundations for future research.
The interesting exception are the 15 studies with z-values greater than 6. Such extreme results cannot be produced by sampling error or p-hacking. Thus, it might be interesting to follow up on these results. However, strong results alone are not sufficient to claim that there are some credible terror management effects. Strong results can also be produced by computational errors or data manipulation (fraud).
I also conducted another regression analysis that examined variation in z-scores. With real effects, studies with larger samples are expected to produce stronger evidence for an effect. The effect of sample size is not linear and can be represented with the standard error, 1/sqrt(N). There was a significant relationship, t(803) = 3.32, p = .001. The average z-scores for samples up to 50 participants was z = 2.45. For samples between 400 and 1,000 participants it was z = 2.87. The difference is 0.42. Adding this to the estimated true average z-score of 0.78, yields z = 0.79 + 0.42 = 1.21, which still implies less than 50% power. In short, the true effect size is so small that even studies with large samples (N > 1,000) are unlikely to produce replicable significant results.
Conclusion
The results here are similar to Chen et al.’s (2025) results, but the interpretation of the results differs. For example, Chen et al. claim that different methods produced different results.
“To summarize our findings, the respective analytic tools point to different conclusions that likely reflect the differences in the philosophies and methodologies of each analytic tool” (p. 17).
Here I showed that methods that do not ignore selection bias largely agree that over 800 studies with significant results provide no credible evidence for any of the hypotheses that were tested by terror management researchers.
Chen et al. (2025) also falsely claim that the average results of meta-analysis are not informative because the average is based on a mixture of good and bad studies
“However, in literature that is as large and diverse as TMT, such an average may not be informative of the typical study. Indeed, an average across a sample that includes both well-designed and inadequately designed TMT studies may be akin to calculating an average of both real effects and false ones” (p. 17).
This claim implies that there is substantial heterogeneity in effect sizes and power, but I demonstrated that there is no evidence of heterogeneity (except for 15 studies with very strong evidence).
Chen et al. (2025) provide different conclusions about the literature. The optimistic view is that several tests rejected the null-hypothesis that all significant results are false positives.
Evidence that supports the MS hypothesis comes from a variety of the measures reviewed above. The p-curve reveals that there is significant evidential value for this literature, and the selection models and WAAP-WLS also identified a significant overall effect. The z-curve’s calculation of the conditional power for this literature also suggests overall evidential value. (p. 17).
The problem with this assessment of the evidence is that it is not clear which of the studies may have produced significant results with a true effect and which ones were false positives. A good study would have produced strong evidence, but there are no studies with strong evidence (again, except the studies with z > 6).
Chen et al. (2025) claim that more recent studies that were conducted after research practices were improved produce stronger evidence.
Studies that were published after many methodological reforms were beginning to be introduced in 2011 revealed significant and adequate evidential value by the p-curve and nominally higher estimates of power by the z-curve. (p. 17)
I examined this claim by fitting a standard z-curve model to studies that were published after 2015. The choice of 2015 is arbitrary and a compromise between recency and number of studies.

The point estimate of the EDR is higher but the confidence interval is wider because there are fewer studies. As a result, it is still not possible to reject the hypothesis that all results are false positives, FDR = 22%, 95%CI = 12% to 100%. The wide confidence intervals also imply that the results are not significantly different from those for the total sample.
I also added publication year to the regression analysis and found that it did not add to the prediction of z-scores after taking sample size into account. Thus, sample sizes have increased, but there is no evidence that more recent studies are more rigorous and powerful, while there is evidence that selection for significance is still prevalent.
Chen et al.’s (2025) last argument is that the results of a multi-lab study provide some support for terror management theory.
“In the multisite replication effort (Klein et al., 2022), the effect size estimates were nominally higher in the author-advised locations than in those that followed an in-house protocol (p. .
Evaluating this claim is beyond my assessment of the meta-analytic results. The results of the many-lab study are independent of the evidence provided by the meta-analysis of over 800 studies that claimed to provide evidence for hundreds of predictions based on terror management theory. These claims are invalidated by the meta-analytic results.
Chen et al. (2025) also take a more conservative approach and point out that that average power estimates with p-curve and z-curve are low.
With regard to replicability, the average conditional power of studies that lead to significant MS effects is very low at 19%–25% (as estimated by the p-curve and z-curve).
They do not mention, however, that these estimates are hypothetical estimates of the probability to obtain a significant result again, if the study could be replicated exactly and the only difference to the original study is a new sample drawn from the same population. It is well known that actual replication studies are never exact (Strobe & Strack, 2014), which lowers the probability of obtaining a significant result again. Actual success rates are somewhere between the unconditional (EDR) and conditional (ERR) estimates and when the EDR is used to predict actual replication outcomes, we cannot reject the hypothesis that most replications will produce a non-significant result because the original result was a false positive result.
Chen et al. (2025) struggle to maintain a conservative perspective. They suggest that sample sizes of N = 400 (n = 200 per cell) would produce more significant results.
The average per-cell sample size of past MS studies is around 28, but a much larger per-cell sample size of n = 200 should theoretically produce more successful replications. (p. 18)
My own power analysis suggested that even studies with N = 400 participants would have less than 50% power to produce a significant result.
It is also not conservative to suggest that there is considerable heterogeneity in effect sizes, suggesting that some results are based on notable actual effects.
“We must keep in mind the heterogeneity of the effects” (p. 18)
Maybe the most important novel contribution of this new analysis with z-curve was to show that there is no evidence of substantial heterogeneity (except for 15 results with very large z-values). Thus, even the claim that there must be some real big effects somewhere among the 800 results is not supported by evidence.
Chen et al.’s (2025) integrated conclusion is that “there must be some nonzero underlying effects in the studies we examined” (p. 18).
This is a surprising claim given the lack of credible evidence. However, the clam is also irrelevant because the point of empirical research is to distinguish between true and false hypotheses. However, research practices in experimental social psychology make it impossible to do so because selection for significance makes significance testing useless (Sterling, 1959!!!). The clearest evidence that we see in the z-curve plot is that results are selected for significance. After taking this bias into account, it is impossible to identify a subset of studies that have high power and are likely to produce significant results again (except for 15 studies with z > 6).
The final conclusion is not a conclusion at all.
First, the literature investigating the MS hypothesis contains studies that appear to be testing nonzero effects, although the literature is highly heterogeneous and underpowered, rendering
many individual effects to be likely spurious.
What does it mean for a literature to contain studies that appear to be testing nonzero effects? It means nothing. Science requires convincing evidence based on credible empirical studies. The meta-analysis is one of the clearest examples that experimental social psychologists did not use empirical studies to test their theories. They conducted studies to provide evidence for their hypotheses and ignored evidence that did not support their claims. It was only after Bem (2011) used the same practices to provide evidence for extrasensory perception that some social psychologists realized that their practices failed to weed out false positive results. The real conclusion from this meta-analysis is that many results that have been produced by social psychologists are not credible and do not advance our scientific understanding of human behavior. However, this clear message could not be published in the Journal of Personality and Social Psychology. So, while it was interesting to see that the journal published a z-curve analysis, it failed to explain the real implications of this meta-analysis. Leading researchers in this field have wasted a lot of their career chasing a phenomenon that may not exist. They falsely assumed that they were providing scientific answers to existential questions. Now at the end of their careers, they are confronted with the uncomfortable truth that their brain-child may die before them. Now there is some terror that needs to be managed and it would be interesting to study how terror management researchers cope with the results of this meta-analysis.
References
Brunner, J. (2018). An even better p-curve. Retrieved January 8, 2020, from https://replicationindex.com/2018/05/10/an-even-better-p-curve
McShane, B.B., Böckenholt U., & Hansen, K.T. (2020). Average Power: A Cautionary Note. Advances in Methods and Practices in Psychological Science, 3(2):185-199. doi:10.1177/2515245920902370
1 thought on “R.I.P Terror Management: A Z-Curve Analysis”