Abstract
A recent article suggested that personality explained most, ~ 80%, of the variance in life-satisfaction. This estimate is much higher than previous studies and meta-analyses suggested. I examine three explanations for this surprising finding. First, the use of multiple-raters removed measurement error and boosted effect size estimates. Second, the use of single items as predictors added incremental predictive validity. Third, the use of ad-hoc items that were administered in the contexts altered the interpretation of life-satisfaction items. My analysis suggests that nuances added only 2% of incremental variance, the use of a multi-rater approach added about 15% more variance, and the survey methodology added about 30% of additional variance. These results suggest that the 80% estimate is misleading and that personality explains about half of the variance in life-satisfaction. This estimate is more in line with behavioral genetics studies of heritability and longitudinal studies of the stability of life-satisfaction. The key personality predictors are dispositions to be in a cheerful mood and not to be in a depressive mood. This finding is consistent with hedonistic theories of wellbeing and previous evidence that people’s life evaluations are related to their affective experiences.
Introduction
The empirical study of personality and wellbeing is nearly 100 years old. Hartmann (1936) showed that Neuroticism predicts self-ratings and peer-ratings of happiness. This finding has been replicated consistently in studies with self-ratings or multi-rater studies of personality and well-being (Anglim et al., 2020; Schimmack & Kim, 2022; Schimmack, Oishi, Furr, & Funder, 2004). Forty years ago, Costa and McCrae showed that Extraversion is an additional predictor of life-satisfaction. While their own multi-rater study failed to replicate this finding (McCrae & Costa, 1991), other studies have confirmed this relationship with self-ratings and informant ratings (Anglim et al., 2020; Schimmack & Kim, 2022; Schimmack et al., 2004). Extraversion and Neuroticism are assumed to be the strongest predictors of life-satisfaction because they have main effects on people’s affective experiences. Neuroticism predicts higher levels of Negative Affect (NA) and Extraversion predicts higher levels of Positive Affect (PA). In turn, PA and NA predict life-satisfaction, and often fully mediate the relationship between these personality traits and life-satisfaction (Schimmack, Diener, & Oishi, 2002; Schimmack & Kim, 2022; Schimmack, Schupp, & Wagener, 2008).
Thirty years ago, McCrae and Costa (1991) found that Agreeableness and Conscientiousness were additional personality predictors of life-satisfaction. Evidence for these additional predictors is more mixed. While meta-analyses confirm this finding (Anglim et al., 2020), individual studies sometimes fail to find effects for Agreeableness, Conscientiousness , or both (Kim, Schimmack, Oishi, Tsutsui, 2018; Schimmack et al., 2008; Schimmack, Schupp, & Wagner, 2008).
While the pattern of relationships is fairly consistent across studies, it has been more difficult to estimate effect sizes of these relationships. One problem is that effect sizes in studies that use self-ratings are inflated by shared method bias. The main problem is desirability bias. Happiness and life-satisfaction are desirable and items used to measure personality also vary in desirability (e.g., lazy, rude, creative, sociable). A few studies have shown that controlling for this bias, reduces effect size estimates (e.g., Kim et al., 20##). However, single-method correlations are also attenuated by random measurement error and systematic rater biases. To control for this bias, it is necessary to model multi-rater data with a measurement model that corrects for random and systematic measurement error.
Schimmack and Kim (2020) published the first and only[let me know about other studies!] study that corrects for random and systematic measurement error in personality and life-satisfaction using a latent variable model of multiple raters. The study used a family round-robin design in which students and their biological parents rated each other on the Big Five personality traits and life-satisfaction. The results are reproduced here in Table 1.

The results are fairly consistent with the meta-analytic results of single-method factors. The reason is that the inflation due to desirability bias and the attenuation due to unique rater biases are of similar magnitude and cancel each other out. In this model, the Big Five are independent and the amount of variance can be summed to compute the total amount of explained variance, r2 = .33, and the multiple correlation, R = .57. The results suggest that the Big Five explain about one-third of the variance in life-satisfaction.
Although many studies rely on the Big Five model to measure personality, most personality researchers agree that the Big Five factors do not capture all personality differences. A prominent model of personality recognizes 30 more specific personality traits called facets (McCrae & Costa, 1992). Some studies have related life-satisfaction to these specific traits. A consistent finding is that most facets do not add to the prediction of life-satisfaction. This means that people can have high life-satisfaction with different personality traits. For example, being orderly (a facet of Conscientiousness) or altruistic (a facet of Agreeableness) do not predict life-satisfaction, suggesting that their are different ways to pursue happiness. The main predictors of life-satisfaction are the Depression facet of Neuroticism and the Cheerfulness facet of Extraversion (Anglim et al. 2020, Røysamb et al., 2018, Schimmack et al., 2004). These facets (Depression, Cheerfulness) are stronger predictors of life-satisfaction than their corresponding Big Five factors (Neuroticism, Extraversion) (Anglim et al., 2020; Schimmack et al., 2004). Røysamb et al. (2018) reported an increase in explained variance from 24% for the Big Five to 32% for facets. Anglim et al.’s (2020) reported simple correlations of r = -.48 for Depression and r = .34 for Cheerfulness. Assuming independence, these correlations imply a multiple correlation of R = .59 and 35% explained variance. Anglim and Grant (2016) found that explained variance increased from 40% to 52%. Thus, mono-method studies suggest that about one-third to one half of the variance in life-satisfaction is explained by personality traits, mainly the disposition to experience cheerfulness and few periods of depressive affect. The use of a multi-method approach to control for measurement error might lead to even higher estimates.
Nuisances
Mõttus et al. , (2019) introduced the notion of personality-item nuances. Nuances represent valid unique variance in personality items that is not explained by the Big Five factors or facets. This variance could predict additional variance in life-satisfaction beyond Depression and Cheerfulness facets. This hypothesis could be tested by showing that nuances have incremental predictive validity over facets, just like previous studies showed that facets have incremental predictive validity over Big Five traits (Schimmack et al., 2004).
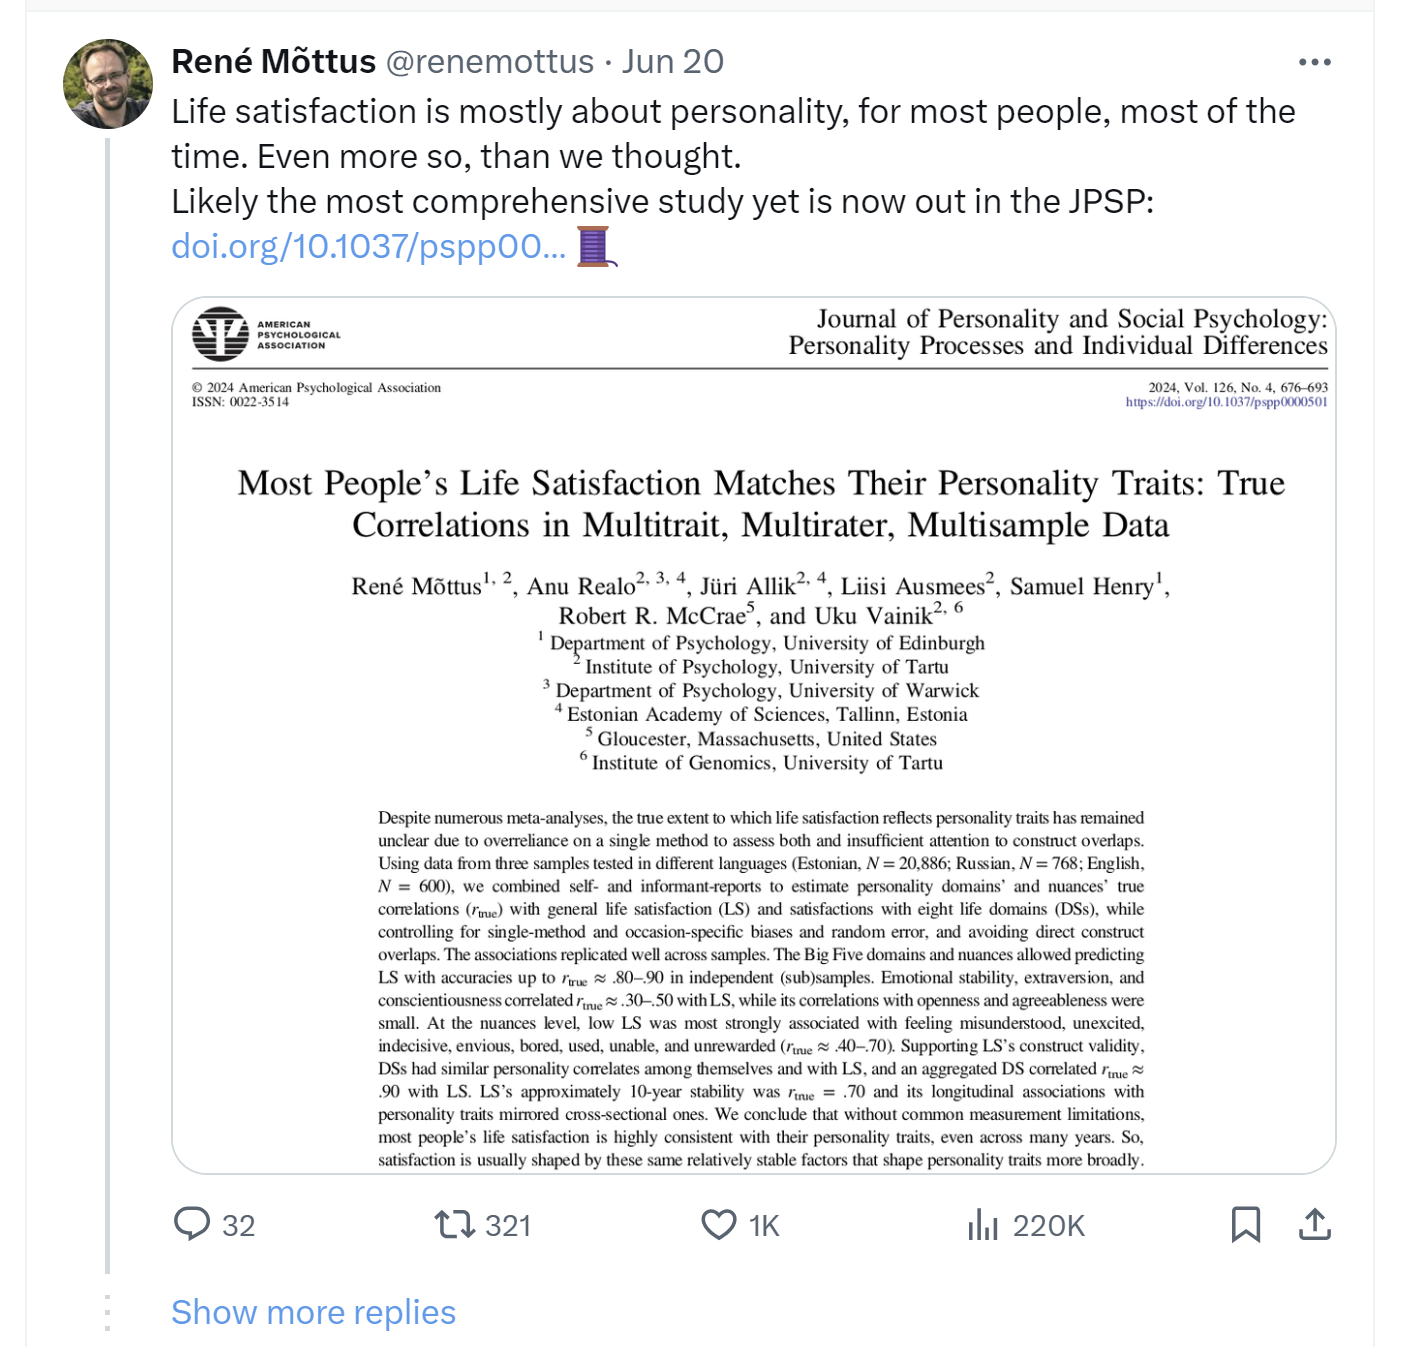
Mõttus, Realo, Allik, Ausmees, and Henry (2004) reported three multi-rater studies of personality and life-satisfaction. Here, I focus on the English sample that had open data. Results for the other two datasets will be reported after I have access to them. Mõttus et al.’s (2004) key result was that a few personality items explained about 80% of the variance in life-satisfaction ratings after correcting for random and systematic measurement error. This is a surprising finding given the literature review of previous studies that suggested even comprehensive facet measures predict only one-third of the variance in life-satisfaction judgments. There are several explanations for the different results. First, it is possible that the personality items in Mõttus et al.’s (2004) item pool have incremental predictive validity over personality facets, especially depressiveness and cheerfulness. Unfortunately, the authors did not examine how much of the variance facets explain in their datasets. Second, it is possible that the use of a multi-method approach dramatically increases the amount of explained variance. Third, it is possible that Mõttus et al.’s (2004) assessment of life-satisfaction produced different results. The main difference to previous studies is that Mõttus et al.’s (2004) did not use a standard measure of life-satisfaction and that their life-satisfaction items were included in the block of personality items. It is possible that participants interpreted these items as personality items rather than questions about life-satisfaction. I conducted the following analyses to examine why Mõttus et al.’s (2004) reported much stronger relationships between personality and life-satisfaction than previous studies.
Results
Single Rater Results
Mõttus et al.’s item pool included enough items to model the facet structure of the Big Five with the exception of a couple of facets (O6: Progressive Values, C1: Self-Efficacy/Confidence). In a single rater model (OSF link: https://osf.io/cev49/), I replicated the finding that self-ratings of life-satisfaction were predicted by Depressiveness, b = -.64, SE = .04, and Cheerfulness, B = .31, SE = .05, as the only predictors. The parallel mono-method results for informant ratings were similar, Depressiveness, b = -.64, SE = .04, Cheerfulness, b = 31, SE = .04. The amount of explained variance in life-satisfaction was 67%, R = .82, for self-ratings and 60%, R = .77 for informant ratings. These effect sizes can be compared to the multiple correlation of R = .90 in Mõttus et al.’s regression model with single-item predictors. The difference is either due to the correction for measurement error, the incremental validity of nuisances, or both. To answer this question, I fitted models that used self-ratings and informant ratings as indicators of life-satisfaction and personality. To simplify these analysis, I used only the Depression and Cheerfulness facets as the Big Five and other facets did not predict life-satisfaction.
Life-Satisfaction Measurement Model
Mõttus et al. did not use a standard life-satisfaction item or scale to measure life-satisfaction. Instead, they used four items from the personality item-pool as indicators of life-satisfaction, namely (a) “Am happy with my life”, (b) “Feel that my life lacks direction”, (c) “Have a dark outlook on the future” (d) “Have been richly blessed in my life.” A multi-rater measurement model had good fit, chi2(5) = 20.02, CFI = .990, RMSEA = .071. One modification index accounted for most of the misfit, chi2(1) = 18.80. The model showed low loadings (< .4) for self-ratings and informant ratings on the item “Have been richly blessed in my life” which was originally intended to measure gratitude. Dropping this item improved fit of the measurement model, chi2(1) = 0.13, CFI = 1.00, RMSEA = .000.
Life-Satisfaction with Depression and Cheerfulness Facets
The next model added the Depressiveness and Cheerfulness items. The model had good fit to the data, chi2(41) = 64.31, CFI = 995, RMSEA = .031. The main finding was that life-satisfaction was predicted by Depression, b = -.69, SE = .04, and Cheerfulness, b = .35, SE = .05. The effect sizes were stronger and the amount of explained variance increased to 80%, R = .91. Importantly, the effect size is as high as the effect size reported for Mõttus et al.’s set of single-item predictors.
Life-Satisfaction with Mõttus et al.’s Strongest Item Predictors
In Figure 1, Mõttus et al. showed items with the strongest correlations with life-satisfaction. I created a multi-rater latent variable model that used the top 5 positive and top 5 negative items as predictors of life-satisfaction. The multiple regression model showed problems with multicollinearity. I therefore opted to enter variables based on their simple correlations. The variables with the strongest simple correlation were “Often feel that others misunderstand me”, r = -.75 and “Find that nothing excites me”, r = -.84. A regression model with both items as predictors showed that both items contributed to the prediction of life-satisfaction, r = -.51 for both items and accounted for 82% of the variance in life-satisfaction, R = .90. This is equivalent to the effect size for the Depression and Cheerfulness facets.
Incremental Predictive Validity
The final model combined the two models. The most important question is how the two items from Mõttus et al.’s item pool relate to personality constructs in the hierarchical model of personality. Item content suggests that they are related to Neuroticism and Extraversion and may also share variance with the Depression and Cheerfulness facets. Fit of the model was good, chi2(70) = 87.53, CFI = .997, RMSEA = .020. Variance in the item “”Find that nothing excites me” was strongly related to Cheerfulness, b = .72, SE = .08, and also related to Depression, b = -.40, SE = .08. The residual variance was only 8%, SE = .11 and not statistically significantly different from zero, 95%CI = .00 to .29. Thus, there is no evidence of nuance variance in this item. The item Often feel that others misunderstand me” was strongly related to Depression, b = .55, and negatively related to Cheerfulness, b = -.30, SE = .08, but 46% of the variance was not predicted by these two facets, 95%CI = .30 to .62. This item also added to the prediction of life-satisfaction, b = -.21, SE = .10, but the evidence is weak, p = .03, and requires replication. The amount of explained variance increased from 81.2% to 83.3%, R = .90 vs. .91.
Discussion
Decades of personality research on wellbeing have established Depressiveness and Cheerfulness as the main predictors of life-satisfaction, but effect size estimates in mono-method studies are biased and may have underestimated the true effect size. Mõttus et al.’s UK data made it possible to obtain effect size estimates using a multi-rater latent variable model. The results replicated Depressiveness and Cheerfulness as the main predictors of life-satisfaction. In addition, the latent variable model suggested that 80% of the variance in life-satisfaction is predicted by these two personality facets after controlling for random and systematic measurement error. Slightly more variance might be explained by adding the nuance variance of the item “often feel misunderstood” to the prediction model. These new results provide important context for Mõttus et al.’s discussion of their results.
Mõttus et al. were surprised by their finding that a few personality items can predict most of the variance in life-satisfaction. Their preferred interpretation of this surprising result is that measurement error attenuated correlations in previous studies and that that the use of single items adds incremental predictive validity because items contain valuable information beyond their relationship to the Big Five. The present results provided little support for these explanations. Even a mono-method analysis of their data showed that facets explained two-thirds of the variance in life-satisfaction ratings, about double of the amount of variance in previous studies. Correcting for measurement error boosted the effect size by another 10-20 percentage points, but the relationship between personality and life-satisfaction is much stronger in this dataset than in previous studies.
Nuances also did not explain the higher amount of explained variances. Only the nuance variance of one item was a significant predictor and added only 2% of explained variance. Most of the 80% explained variance could be predicted by the facet predictors Depression and Cheerfulness. Thus, the dataset provides further evidence that these two facets are the main personality predictors of life-satisfaction. A plausible explanation for this finding is that experiences of positive versus negative affect are an important aspect of life-satisfaction (Schimmack et al., 2002) and that biological dispositions influence how people are feeling. These feelings color life-evaluations with the proverbial rose-colored or cloudy glasses.
The main reason for Mõttus et al.’s large amount of explained variance appears to be unique to this dataset. The most salient difference between this study and previous studies is the way life-satisfaction was measured. Whereas previous studies asked about life-satisfaction in a separate block of items and used validated items, Mõttus et al.’s used ad-hoc items that were mixed personality items in a single block. It is possible that participants interpret items differently when they are presented in different contexts. Future research needs to examine in more detail the cognitive processes underlying personality and life-satisfaction ratings. Valid life-satisfaction ratings are expected to be more strongly related to evaluations of specific life domains because life as a whole is made up of these domains (Payne & Schimmack, 2020).
The main limitation of this study was that life-satisfaction was measured with an unusual set of items that were embedded in the personality questionnaire. This raises the concern that responses to these items were based on the same type of information that was used to make personality ratings. It is therefore necessary to replicate the results in a study in which life-satisfation judgments were made independently – and ideally before – personality questions. Another problem of the study was the use of a single informant. This makes it difficult to model self-informant agreement because it is unclear whether self-ratings or informant ratings are more valid. To model the data, it is necessary to make the assumption that self-ratings and informant ratings are equally valid. While this is a reasonable assumption (Schimmack & Kim, 2022), but the results need to be replicated with multiple informants that require fewer assumptions to model measurement error.
Finally, it is noteworthy that self-informant agreement in this dataset is above the usual levels observed for personality traits (Connely et al., ###) and life-satisfaction (Schneider & Schimmack, 2009; Zou et al., 2013). Typically self-informant agreement for life-satisfaction is between .3 and .4, even after correcting for unreliability. In Mõttus et al.’s UK data the correlation is r = .74. This suggests that the ratings were not done independently or some reports were filled out by the same person.
In conclusion, Mõttus et al. aimed to estimate the relationship between life-satisfaction and personality while controlling for random and systematic measurement error. They found that personality explained about 80% of the variance in life-satisfaction ratings. They attributed this strong relationship to a few personality items. I showed that much of this relationship is accounted for by the Depression facet of Neuroticism and the Cheerfulness facet of Extraversion. Only nuance variance of one item might add another 2% to the prediction. The finding that Depression and Cheerfulness are the strongest personality predictors of life-satisfaction are consistent with previous studies and highlight the importance of affective experiences in life-evaluations (Costa & McCrae, 1980; Schimmack et al., 2002; Schimmack & Kim, 2020). I also found that the mono-method relationships between life-satisfaction and personality in this dataset was much stronger than in previous studies. The most likely reason for this difference is that the life-satisfaction items were administered concurrently with the personality items and that this may have altered the way participants’ interpreted these items. Future research needs to manipulate item-context to test this hypothesis.
The results also provide further evidence that many personality traits are not related to life-satisfaction. This means that there are different ways to pursue happiness and people with different personalities can have high wellbeing by creating lives that match their personalities. Humanistic psychologists have called this self-actualization. The main obstacle towards achieving high wellbeing appears to be a melancholic personality disposition. Interestingly, not all negative affects are detrimental and more research needs to examine the distinction between them.
References
Anglim, J., Horwood, S., Smillie, L. D., Marrero, R. J., & Wood, J. K. (2020). Predicting psychological and subjective well-being from personality: A meta-analysis. Psychological Bulletin, 146, 279–323. https://doi.org/10.1037/bul0000226
Costa, P. T., Jr., & McCrae, R. R. (1980). Influence of Extraversion and Neuroticism on subjective wellbeing: Happy and unhappy people. Journal of Personality and Social Psychology, 38, 668-678.
Costa, P. T., & McCrae, R. R. (1992). Revised NEO Personality Inventory (NEO PI-R) and NEO Five-Factor Inventory (NEO-FFI) professional manual. Psychological Assessment Resources.
McCrae, R. R., & Costa, P. T. (1991). Adding Liebe und Arbeit: The Full Five-Factor Model and Well-Being. Personality and Social Psychology Bulletin, 17, 227–232. https://doi.org/10.1177/014616729101700217
Payne, J. W., & Schimmack, U. (2020). Construct validity of global life-satisfaction judgments: A look into the black box of self–informant agreement. Journal of Research in Personality, 89, 104041. https://doi.org/10.1016/j.jrp.2020.104041
Røysamb, E., Nes, R. B., Czajkowski, N. O., & Vassend, O. (2018). Genetics, personality and wellbeing. A twin study of traits, facets and life satisfaction. Scientific Reports, 8(1), 12298. https://doi.org/10.1038/s41598-018-29881-x
Schimmack, U. (2010). What multi-method data tell us about construct validity. European Journal of Personality, 24, 241–257. https://doi.org/10.1002/per.771
Schimmack, U., & Kim, H. (2020). An integrated model of social psychological and personality psychological perspectives on personality and wellbeing. Journal of Research in Personality, 84, Article 103888. https://doi.org/10.1016/j.jrp.2019.103888
Schimmack, U., Oishi, S., Furr, R. M., & Funder, D. C. (2004). Personality and Life Satisfaction: A Facet-Level Analysis. Personality and Social Psychology Bulletin, 30, 1062–1075.
https://doi.org/10.1177/0146167204264292
Schneider, L., & Schimmack, U. (2009). Self-Informant Agreement in Well-Being Ratings: A Meta-Analysis. Social Indicators Research, 94, 363. https://doi.org/10.1007/s11205-009-9440-y
Schimmack, U., Schupp, J., & Wagner, G. G. (2008). The influence of environment and personality on the affective and cognitive component of subjective well-being. Social Indicators Research, 89(1), 41–60. https://doi.org/10.1007/s11205-007-9230-3