This is the third part in a mini-series of building a monster-model of well-being. The first part (Part1) introduced the measurement of well-being and the relationship between affect and well-being. The second part added measures of satisfaction with life-domains (Part 2). Part 2 ended with the finding that most of the variance in global life-satisfaction judgments is based on evaluations of important life domains. Satisfaction in important life domains also influences the amount of happiness and sadness individuals experience, but affect had relatively small unique effects on global life-satisfaction judgments. In fact, happiness made a trivial, non-significant unique contribution.
The effects of the various life domains on happiness, sadness, and the weighted average of domain satisfactions is shown in the table below. Regarding happy affective experiences, the results showed that friendships and recreations are important for high levels of positive affect (experiencing happiness), but health or money are relatively unimportant.
In part 3, I am examining how we can add the personality trait extraversion to the model. Evidence that extraverts have higher well-being was first reviewed by Wilson (1967). An influential article by Costa and McCrae (1980) showed that this relationship is stable over a period of 10 years, suggesting that stable dispositions contribute to this relationship. Since then, meta-analyses have repeatedly reaffirmed that extraversion is related to well-being (DeNeve & Cooper, 1998; Heller et al., 2004; Horwood, Smillie, Marrero, Wood, 2020).
Here, I am examining the question how extraversion influences well-being. One criticism of structural equation modeling of correlational, cross-sectional data is that causal arrows are arbitrary and that the results do not provide evidence of causality. This is nonsense. Whether a causal model is plausible or not depends on what we know about the constructs and measures that are being used in a study. Not every study can test all assumptions, but we can build models that make plausible assumptions given well-established findings in the literature. Fortunately, personality psychology has established some robust findings about extraversion and well-being.
First, personality traits and well-being measures show evidence of heritability in twin studies. If well-being showed no evidence of heritability, we could not postulate that a heritable trait like extraversion influences well-being because genetic variance in a cause would produce genetic variance in an outcome.
Second, both personality and well-being have a highly stable variance component. However, the stable variance in extraversion is larger than the stable variance in well-being (Anusic & Schimmack, 2016). This implies that extraversion causes well-being rather than the other way-around because causality goes from the more stable variable to the less stable variable (Conley, 1984). The reasoning is that a variable that changes quickly and influences another variable would produce changes, which contradicts the finding that the outcome is stable. For example, if height were correlated with mood, we would know that height causes variation in mood rather than the other way around because mood changes daily, but height does not. We also have direct evidence that life events that influence well-being such as unemployment can change well-being without changing extraversion (Schimmack, Wagner, & Schupp, 2008). This implies that well-being does not cause extraversion because the changes in well-being due to unemployment would then produce changes in extraversion, which is contradicted by evidence. In short, even though the cross-sectional data used here cannot test the assumption that extraversion causes well-being, the broader literature makes it very likely that causality runs from extraversion to well-being rather than the other way around.
Despite 50-years of research, it is still unknown how extraversion influences well-being. “It is widely appreciated that extraversion is associated with greater subjective well-being. What is not yet clear is what processes relate the two” ((Harris, English, Harms, Gross, & Jackson, 2017, p. 170). Costa and McCrae (1980) proposed that extraversion is a disposition to experience more pleasant affective experiences independent of actual stimuli or life circumstances. That is, extraverts are disposed to be happier than introverts. A key problem with this affect-level model is that it is difficult to test. One way of doing so is to falsify alternative models. One alternative model is the affective reactivity model. Accordingly, extraverts are only happier in situations with rewarding stimuli. This model implies personality x situation interactions that can be tested. So far, however, the affective reactivity model has received very little support in several attempts (Lucas & Baird, 2004). Another model assumes that extraversion is related to situation selection. Extraverts may spend more time in situations that elicit pleasure. Accordingly, both introverts and extraverts enjoy socializing, but extraverts actually spend more time socializing than introverts. This model implies person-situation correlations that can be tested.
Nearly 20 yeas ago, I proposed a mediation model that assumes extraversion has a direct influence on affective experiences and the amount of affective experiences is used to evaluate life-satisfaction (Schimmack, Diener, & Oishi, 2002). Although cited relatively frequently, none of these citations are replication studies. The findings above cast doubt on this model because there is no direct influence of positive affect (happiness) on life-satisfaction judgments.
The following analyses examine how extraversion is related to well-being in the Mississauga Family Study dataset.
1. A multi-method study of extraversion and well-being
I start with a very simple model that predicts well-being from extraversion, CFI = .989, RMSEA = .027. The correlated residuals show some rater-specific correlations between ratings of extraversion and life-satisfaction. Most important, the correlation between the extraversion and well-being factors is only r = .11, 95%CI = .03 to .19.
The effect size is noteworthy because extraversion is often considered to be a very powerful predictor of well-being. For example, Kesebir and Diener (2008) write “Other than extraversion and neuroticism, personality traits such as extraversion … have been found to be strong predictors of happiness” (p. 123)
There are several explanations for the week relationship in this model. First, many studies did not control for shared method variance. Even McCrae and Costa (1991) found a weak relationship when they used informant ratings of extraversion to predict self-ratings of well-being, but they ignored the effect size estimate.
Another possible explanation is that Mississauga is a highly diverse community and that the influence of extraversion on well-being can be weaker in non-Western samples (r ~ .2, Kim et al. , 2017.
I next added the two affect factors (happiness and sadness) to the model to test the mediation model. This model had good fit, CFI = .986, RMSEA = .026. The moderate to strong relationships from extraversion to happy feelings and happy feelings to life-satisfaction were highly significant, z > 5. Thus, without taking domain satisfaction into account, the results appear to replicate Schimmack et al.’s (2002) findings.
However, including domain satisfaction changes the results, CFI = .988, RMSEA = .015.
Although extraversion is a direct predictor of happy feelings, b = .25, z = 6.5, the non-significant path from happy feelings to life-satisfaction implies that extraversion does not influence life-satisfaction via this path, indirect effect b = .00, z = 0.2. Thus, the total effect of b = .14, z = 3.7, is fully mediated by the domain satisfactions.
A broad affective disposition model would predict that extraversion enhances positive affect across all domains, including work. However, the path coefficients show that extraversion is a stronger predictor of satisfaction with some domains than others. The strongest coefficients are obtained for satisfaction with friendships and recreation. In contrast, extraversion has only very small relationships with financial satisfaction, health satisfaction, or housing satisfaction that are not statistically significant. Inspection of the indirect effects shows that friendship (b = .026), leisure (.022), romance (.026), and work (.024) account for most of the total effect. However, power is too low to test significance of individual path coefficients.
Conclusion
The results replicate previous work. First, extraversion is a statistically significant predictor of life-satisfaction, even when method variance is controlled, but the effect size is small. Second, extraversion is a stronger predictor of happy feelings than life-satisfaction and unrelated to sad feelings. However, the inclusion of domain satisfaction judgments shows that happy feelings do not mediate the influence of extraversion on life-satisfaction. Rather, extraversion predicts higher satisfaction with some life domains. It may seem surprising that this is a new finding in 2021, 40-years after Costa and McCrae (1980) emphasized the importance of extraversion for well-being. The reason is that few psychological studies of well-being include measures of domain satisfaction and few sociological studies of well-being include personality measures (Schimmack, Schupp, & Wagner, 2008). The present results show that it would be fruitful to examine how extraversion is related to satisfaction with friendships, romantic relationships, and recreation. This is an important avenue for future research. However, for the monster model of well-being the next step will be to include neuroticism in the model. Continue here to go to Part 4
With 4,366 citations in WebOfScience, Taylor and Brown’s article “ILLUSIONS AND WELL-BEING: A SOCIAL PSYCHOLOGICAL PERSPECTIVE ON MENTAL-HEALTH” is one of the most cited articles in social psychology.
The key premises of the article is that human information processing is faulty and that mistakes are not random. Rather human information processing is systematically biased.
Taylor and Brown (1988) quote Fiske and Taylor’s (1984) book about social cognitions to support this assumption. “Instead of a naïve scientist entering the environment in search of the truth, we find the rather unflattering picture of a charlatan trying to make the data come out in a manner most advantageous to his or her already-held theories” (p. 88).
30 years later, a different picture emerges. First, evidence has accumulated that human information processing is not as faulty as social psychologists assumed in the early 1980s. For example, personality psychologists have shown that self-ratings of personality have some validity (Funder, 1995). Second, it has also become apparent that social psychologists have acted like charlatans in their research articles, when they used questionable research practices to make unfounded claims about human behavior. For example, Bem (2011) used these methods to show that extrasensory perception is real. This turned out to be a false claim based on shoddy use of the scientific method.
Of course, a literature with thousands of citations also has produced a mountain of new evidence. This might suggest that Taylor and Brown’s claims have been subjected to rigorous tests. However, this is actually not the case. Most studies that examined the benefits of positive illusions relied on self-ratings of well-being, mental-health, or adjustment to demonstrate that positive illusions are beneficial. The problem is evident. When self-ratings are used to measure the predictor and the criterion, shared method variance alone is sufficient to produce a positive correlation. The vast majority of self-enhancement studies relied on this flawed method to examine the benefits of positive illusions (see meta-analysis by Dufner, Gebauer, & Sedikides, 2019).
However, there are a few attempts to demonstrate that positive illusions about the self predict well-being measures is measured by informant ratings to reduce the influence of shared method variance. The most prominent example is Taylor et al. (2003) article ” Portrait of the self-enhancer: Well adjusted and well liked or maladjusted and friendless.” [Sadly, this was published in the Personality section of JPSP]
The abstract gives the impression that the results clearly favored Taylor’s positive illusions model. However, a closer inspection of reality shows that the abstract is itself illusory and disconnected from reality.
First, the study had a small sample size (N = 92). Second, only about half of these participants . Informant ratings were obtained from a single friend, but only 55 participants identified a friend who provided informant ratings. Even in 2003, it was common to use larger samples and more informants to measure well-being (e.g., Schimmack, & Diener, 2003). Moreover, friends are not as good as family members to report on well-being (Schneider & Schimmack, 2009). It only attests to Taylor’s social power that such a crappy, underpowered study was published in JPSP.
The results showed no significant correlations between various measures of positive illusions (self-enhancement) and peer-ratings of mental health (last row).
Thus, the study provided no evidence for the claim in the abstract that positive illusions about the self predict well-being or mental health without the confound of shared method variance.
Meta-Analysis
Dufner, Gebauer, Sedikides, and Denissen (2019) conducted a meta-analysis of the literature. The abstract gives the impression that there is a clear positive effect of positive illusions on well-being.
Not surprisingly, studies that used self-ratings of adjustment/well-being/mental health showed positive association. The more interesting question is how self-enhancement measures are related to non-self-report measures of well-being. Table 3 shows that the meta-analysis identified 22 studies with an informant-rating of well-being and that these studies showed a small positive relationship, r = .12.
I was surprised that the authors found 22 studies because my own literature research uncovered fewer studies. So, I took a closer look at the 22 studies included in the meta-analysis (see APPENDIX).
Many of the studies relied on measures of social desirable responding (Marlow-Crowne Social Desirability Scale, Balanced -Inventory-of-Desirable Responding) as a measure of positive illusions. The problem with these studies is that social desirability scales also contain a notable portion of real personality variance. Thus, these studies do not conclusively demonstrate that illusions are related to informant ratings of adjustment. Paulhus’s studies are problematic because adjustment ratings were based on first-impressions in a zero-acquaintance relationship, and the results changed over time. Self-enhancers were perceived as better adjusted in the beginning, but as less adjusted later on. The problem here is that well-being ratings in this context have low validity. Finally, most studies were underpowered given the estimated population effect size of r = .12. The only reasonably powered study by Church et al. with 900 participants produced a correlation of r = .17 with an unweighted measure and r = .08 with a weighted measure. Overall, this evidence does not provide clear evidence that positive illusions about the self have positive effects. They actually show that any beneficial effects would be small.
New Evidence
In a forthcoming JRP article, Hyunji Kim and I present the most comprehensive test of Taylor’s positive illusion hypothesis (Schimmack & Kim, 2019). We collected data from 458 triads (students with both biological parents living together). We estimated separate models for students, mothers, and fathers as targets. In each model, targets self-ratings of the Big Five personality ratings were modelled with the halo-alpha-beta model, where the halo factor represents positive illusions about the self (Anusic et al., 2009). The halo factor was then allowed to predict the shared variance in well-being ratings by all three raters, and well-being ratings were based on three indicators (global life-satisfaction, average domain satisfaction, and hedonic balance, cf. Zou, Schimmack, & Gere, 2013).
The structural equation model is shown in Figure 1. The complete data, MPLUS syntax and output files and a preprint of the article are available on OSF ( https://osf.io/6z34w/).
The key findings are reported in Table 6. There were no significant relationships between self-rated halo bias and the shared variance among ratings of well-being across the three raters. Although this finding does not prove that positive illusions are not beneficial, the results suggest that it is rather difficult to demonstrate these benefits even in reasonably powered studies to detect moderate effect sizes.
The study did replicate much stronger relationships with self-ratings of well-being. However, this finding begs the question whether positive illusions are beneficial only in ways that are not visible to close others or whether these relationships simply reflect shared method variance.
Conclusion
Over 30 years ago, Taylor and Brown made the controversial proposal that humans benefit from distorted perceptions of reality. Only this year, a meta-analysis claimed that there is strong evidence to support this claim. I argue that the evidence in support of the illusion model is itself illusory because it rests on studies that relate self-ratings to self-ratings. Given the pervasive influence of rating biases on self-ratings, shared method variance alone is sufficient to explain positive correlations in these studies (Campbell & Fiske, 1959). Only a few studies have attempted to address this problem by using informant ratings of well-being as an outcome measure. These studies tend to find weak relationships that are often not significant. Thus, there is currently no scientific evidence to support Taylor and Brown’s social psychological perspective on mental health. Rather, the literature on positive illusions provides further evidence that social and personality psychologists have been unable to subject the positive illusions hypothesis to a rigorous test. To make progress in the study of well-being it is important to move beyond the use of self-ratings to reduce the influence of method variance that can produce spurious correlations among self-report measures.
APPENDIX
Article#
Title
Study
Informants
N
SR
IR
1
Do Chinese Self-Enhance or Self-Efface?
It’s a Matter of Domain
1
Table 4
helpfulness
neuroticism
130
0.48
0.01
2
How self-enhancers adapt well to loss: the mediational role of loneliness
and social functioning
1
BIDR-SD
SR symptoms (reversed) / IR mental health
57
0.24
0.34
3
Portrait of the self- enhancer:Well- adjusted and well- liked or
maladjusted and friendless?
1
4
Social Desirability Scales: More Substance Than Style
1
Table 2
MCSD
depression (reversed)
215
0.49
0.31
5
Substance and bias in social desirability responding.
1
2 Friends
Table 2
SDE
neuroticism (reversed)
67
0.39
0.26
6
Interpersonal and intrapsychic adaptiveness of trait self-enhancement: A
mixed blessing
1a
Zero-Aquaintance
Table 2 Time 1
Trait SE
Adjustment
124
NA
0.36
6
Interpersonal and intrapsychic adaptiveness of trait self-enhancement: A
mixed blessing
1b
Zero-Aquaintance
Table 2 Time 2
Trait SE
Adjustment
124
NA
-0.11
6
Interpersonal and intrapsychic adaptiveness of trait self-enhancement: A
mixed blessing
2
Zero-Aquaintance
Table 4 Time 1
Trait SE
Adjustment
89
NA
0.35
6
Interpersonal and intrapsychic adaptiveness of trait self-enhancement: A
mixed blessing
2
Zero-Aquaintance
Table 4 Time 1
Trait SE
Adjustment
89
NA
-0.22
7
A test of the construct validity of the Five-Factor Narcissism Inventory
1
1 Peer
Table 1
FFNI Vulnerability
Neuroticism
287
0.5
0.33
8
Moderators of the adaptiveness of self-enhancement: Operationalization,
motivational domain, adjustment facet, and evaluator
1
3 Peers/Family Members
Self-Residuals
Adjustment
123
0.22
-0.2
9
Grandiose and Vulnerable Narcissism: A Nomological Network Analysis
1
NA
NA
10
Socially desirable responding in personality assessment: Still more
substance than style
1a
1 Roommate
Table 1
MCSD
neuroticism (reversed)
128
0.41
0.06
10
Socially desirable responding in personality assessment: Still more
substance than style
1b
Parents
Table 1
MCSD
neuroticism (reversed)
128
0.41
0.09
11
Two faces of human happiness: Explicit and implicit life-satisfaction
1a
1 Peer
Table 1
BIDR-SD
PANAS
159
0.45
0.17
11
Two faces of human happiness: Explicit and implicit life-satisfaction
1b
1 Peer
Table 1
BIDR-SD
LS
159
0.36
-0.03
12
Socially desirable responding in personality assessment: Not necessarily
faking and not necessarily substance
1
1 roommate
Table 2
BIDR-SD
neuroticism (reversed)
602
0.26
0.02
13
Depression and the chronic pain experience
1
none
MCSD
NA
NA
14
Trait self-enhancement as a buffer against potentially traumatic events:
A prospective study
1
Friends
Table 5
BIDR-SD
mental health
32
NA
-0.01
15
Big Tales and Cool Heads: Academic Exaggeration Is Related to Cardiac
Vagal Reactivity
1
62
NA
NA
16
Are Actual and Perceived Intellectual Self-enhancers Evaluated
Differently bySocial Perceivers?
1
1 Friend
Table 1 / above diagonal
SE intelligence
neuroticism (reversed)
337
0.17
0.15
16
Are Actual and Perceived Intellectual Self-enhancers Evaluated
Differently bySocial Perceivers?
3
Zero-Aquaintance
Table 1 / below diagonal
SE intelligence
neuroticism (reversed)
183
0.19
0.38
17
Response artifacts in the measurement of subjective well-being
1
7 friends / family
Table 1
MCSD
LS
108
0.3
0.36
18
A Four-Culture Study of Self-Enhancement and Adjustment Using the
1a
6 friends/ family
Table 6 SRM unweighted
SRM
LS
900
0.53
0.17
18
A Four-Culture Study of Self-Enhancement and Adjustment Using the
1b
6 friends/ family
Table 6 SRM weighted
SRM
LS
900
0.49
0.08
19
You Probably Think This Paper’s About You: Narcissists’ Perceptions of
Their Personality and Reputation
1
NA
NA
20
What Does the Narcissistic Personality Inventory Really Measure?
4
Roommates
NPI-Grandiose
College Adjustment
200
0.48
0.27
21
Self-enhancement as a buffer against extreme adversity: Civil war in
Bosnia and traumatic loss in the United States
1
Mental Health Experts
Self-Peer Dis
adjustment difficulties (reversed)
78
0.47
0.27
21
Self-enhancement as a buffer against extreme adversity: Civil war in
Bosnia and traumatic loss in the United States
2
Mental Health Experts
Table 2 25 months
BIDR-SD
self distress / MHE PTSD
74
0.3
0.35
22
Self-enhancement among high-exposure survivors of the September 11th
terrorist attack: Resilience or social maladjustment
1
Friend/Family
BIDR-SD
self depression 18 months / mental health
45
0.29
0.33
23
Decomposing a Sense of Superiority: The Differential Social Impact of
Self-Regard and Regard for Others
1
Zero-Aquaintance
SRM
neuroticism (reversed)
235
NA
0.02
24
Personality, Emotionality, and Risk Prediction
1
94
NA
NA
24
Personality, Emotionality, and Risk Prediction
2
119
NA
NA
25
Social desirability scales as moderator and suppressor variables
In the old days, most scientific communication occured behind closed doors, when reviewers provide anonymous peer-reviews that determine the fate of manuscripts. In the old days, rejected manuscripts would not be able to contribute to scientific communications because nobody would know about them.
All of this has changed with the birth of open science. Now authors can share manuscripts on pre-print servers and researchers can discuss merits of these manuscripts on social media. The benefit of this open scientific communication is that more people can join in and contribute to the communication.
I have criticized their model in an in press article in Perspectives of Psychological Science (Schimmack, 2019). In a commentary, Yoav and Michelangelo argue that their model is “compatible with the logic of an MTMM investigation (Campbell & Fiske, 1959). They argue that it is important to have multiple traits to identify method variance in a matrix with multiple measures of multiple traits. They then propose that I lost the ability to identify method variance by examining one attitude (i.e., race, self-esteem, political orientation) at a time. They then point out that I did not include all measures and included the Modern Racism Scale as an indicator of political orientation to note that I did not provide a reason for these choices. While this is true, Yoav and Michelangelo had access to the data and could have tested whether these choices made any differences. They do not. This is obvious for the modern racism scale that can be eliminated from the measurement model without any changes in the overall model.
To cut to the chase, the main source of disagreement is the modelling of method variance in the multi-trait-multi-method data set. The issue is clear when we examine the original model published in Bar-Anan and Vianello (2018).
In this model, method variance in IATs and related tasks like the Brief IAT is modelled with the INDIRECT METHOD factor. The model assumes that all of the method variance that is present in implicit measures is shared across attitude domains and across all implicit measures. The only way for this model to allow for different amounts of method variance in different implicit measures is by assigning different loadings to the various methods. Moreover, the loadings provide information about the nature of the shared variance and the amount of method variance in the various methods. Although this is valuable and important information, the authors never discuss this information and its implications.
Many of these loadings are very small. For example, the loading of the race IAT and the brief race IAT are .11 and .02. In other words, the correlation between these two measures is inflated by .11 * .02 = .0022 points. This means that the correlation of r = .52 between these two measures is r = .5178 after we remove the influence of method variance.
It makes absolutely no sense to accuse me of separating the models, when there is no evidence of implicit method variance that is shared across attitudes. The remaining parameter estimates are not affected if a factor with low loadings is removed from a model.
Here I show that examining one attitude at a time produces exactly the same results as the full model. I focus on the most controversial IAT; the race IAT. After all, there is general agreement that there is little evidence of discriminant validity for political orientation (r = .91, in the Figure above), and there is little evidence for any validity in the self-esteem IAT based on several other investigations of this topic with a multi-method approach (Bosson et al., 2000; Falk et al., 2015).
Model 1 is based on Yoav and Michelangelo’s model that assumes that there is practically no method variance in IAT-variants. Thus, we can fit a simple dual-attitude model to the data. In this model, contact is regressed onto implicit and explicit attitude factors to see the unique contribution of the two factors without making causal assumptions. The model has acceptable fit, CFI = .952, RMSEA = .013.
The correlation between the two factors is .66, while it is r = .69 in the full model in Figure 1. The loading of the race IAT on the implicit factor is .66, while it is .62 in the full model in Figure 1. Thus, as expected based on the low loadings on the IMPLICIT METHOD factor, the results are no different when the model is fitted only to the measure of racial attitudes.
Model 2 makes the assumption that IAT-variants share method variance. Adding the method factor to the model increased model fit, CFI = .973, RMSEA = .010. As the models are nested, it is also possible to compare model fit with a chi-square test. With five degrees of freedom difference, chi-square changed from 167. 19 to 112.32. Thus, the model comparison favours the model with a method factor.
The main difference between the models is that there the evidence is less supportive of a dual attitude model and that the amount of valid variance in the race IAT decreases from .66^2 = 43% to r = .47^2 = 22%.
In sum, the 2018 article made strong claims about the race IAT. These claims were based on a model that implied that there is no systematic measurement error in IAT scores. I showed that this assumption is false and that a model with a method factor for IATs and IAT-variants fits the data better than a model without such a factor. It also makes no theoretical sense to postulate that there is no systematic method variance in IATs, when several previous studies have demonstrated that attitudes are only one source of variance in IAT scores (Klauer, Voss, Schmitz, & Teige-Mocigemba, 2007).
How is it possible that the race IAT and other IATs are widely used in psychological research and on public websites to provide individuals with false feedback about their hidden attitudes without any evidence of its validity as an individual difference measure of hidden attitudes that influence behaviour outside of awareness?
The answer is that most of these studies assumed that the IAT is valid rather than testing its validity. Another reason is that psychological research is focused on providing evidence that confirms theories rather than subjecting theories to empirical tests that they may fail. Finally, psychologists ignore effect sizes. As a result, the finding that IAT scores have incremental predictive validity of less than 4% variance in a criterion is celebrated as evidence for the validity of IATs, but even this small estimate is based on underpowered studies and may shrink in replication studies (cf. Kurdi et al., 2019).
It is understandable that proponents of the IAT respond with defiant defensiveness to my critique of the IAT. However, I am not the first to question the validity of the IAT, but these criticisms were ignored. At least Banaji and Greenwald recognized in 2013 that they do “not have the luxury of believing that what appears true and valid now will always appear so” (p. xv). It is time to face the facts. It may be painful to accept that the IAT is not what it was promised to be 21 years ago, but that is what the current evidence suggests. There is nothing wrong with my models and their interpretation, and it is time to tell visitors of the Project Implicit website that they should not attach any meaning to their IAT scores. A more productive way to counter my criticism of the IAT would be to conduct a proper validation study with multiple methods and validation criteria that are predicted to be uniquely related to IAT scores in a preregistered study.
Naive and more sophisticated conceptions of science assume that empirical data are used to test theories and that theories are abandoned when data do not support them. Psychological journals give the impression that psychologists are doing exactly that. Journals are filled with statistical hypothesis tests. However, hypothesis tests are not theory tests because only results that confirm a theoretical prediction (by falsifying the null-hypothesis) get published; p < .05 (Sterling, 1959). As a result, psychology journals are filled with theories that have never been properly tested. Chances are that some of these theories are false.
To move psychology towards being a science, it is time to subject theories to empirical tests and to replace theories that do not fit the data with theories that do. I have argued elsewhere already that higher-order models of personality are a bad idea with little empirical support (Schimmack, 2019a). Colin DeYoung responded to this criticism of his work (DeYoung, 2019). In this blog post, I present a new approach to the testing of structural theories of personality with confirmatory factor analysis (CFA). The advantage of CFA is that it is a flexible statistical method that can formalize a variety of competing theories. Another advantage of CFA is that it is possible to capture and remove measurement error. Finally, CFA provides fit indices that make it possible to compare models and to select models that fit the data better. Although CFA celebrates its 50th birthday this year, psychologists still have to appreciate its potential for testing personality theories (Joreskog, 1969).
What are Higher-Order Factors?
The notion of a factor has a clear meaning in psychology. A factor is a common cause that explains, at least in a statistical sense, why several variables are correlated with each other. That is, a factor represents the shared variance among several variables that is assumed to be caused by a common cause rather than by direct causation among the variables.
In traditional factor analysis, factors explain correlations among observed variables such as personality ratings. The notion of higher-order factors implies that first-order factors that explain correlations among items are correlated (i.e., not independent) and that these correlations among factors are explained by another set of factors, which are called higher-order factors.
In empirical tests of higher-order factors it has been overlooked that the Big Five factors are already higher-order factors in a hierarchy of personality traits that explain correlations among more specific personality traits like sociability, curiosity, anxiety, or impulsiveness. Instead ALL tests of higher-order models have relied on items or scales that measure the Big Five. This makes it very difficult to study the higher-order structure of personality because results will vary depending on the selection of items that are used to create Big Five scales.
A much better way to test higher-order models is to fit a hierarchical CFA model to data that represent multiple basic personality traits. A straightforward prediction of a higher-order model is that all or at least most facets that belong to a common higher order factor should be correlated with each other.
For example, Digman (1997) and DeYoung (2006) suggested that extraversion and openness are positively correlated because they are influenced by a common factor, called beta or plasticity. As extraversion is conceived as a common cause of sociability, assertiveness, and cheerfulness and openness is conceived as a common cause of being imaginative, artistic, and reflective, the model makes the straightforward prediction that sociability, assertiveness, and cheerfulness are positively correlated with being imaginative, artistic, and reflective.
Evaluative Bias
One problem in testing structural models of personality is that personality ratings are imperfect indicators of personality. Some of the measurement error in personality ratings is random, but other sources of variance are systematic. Two sources have been reliably identified, namely acquiescence and evaluative bias (Anusic et al., 2009; Biderman et al., 2019). DeYoung (2006) also found evidence for evaluative bias in a multi-rater study. Thus, there is agreement between DeYoung and me that some of the correlations among personality ratings do not reflect the structure of personality, but rather systematic measurement error. It is necessary to control for these method factors when studying the structure of personality traits and to examine the correlation among Big Five traits because method factors distort these correlations in mono-method studies. In two previous posts, I found no evidence of higher-order factors when I fitted hierarchical models to the 30 facets of the NEO-PI-R and another instrument with 24 facets (Schimmack, 2019b, 2019c). Here I take another look at this question by examining more closely the pattern of correlations among personality facets before and after controlling for method variance.
Data
From 2010 to 2012 I posted a personality questionnaire with 303 items on the web. Visitors were provided with feedback about their personality on the Big Five dimensions and specific personality facets. Earlier I presented a hierarchical model of these data with three items per facet (Schimmack, 2019). Subsequently, I examined the loadings of the remaining items on these facets. Here I presents results for 179 items with notable loadings on one of the facets (Item.Loadings.303.xlsx; when you open file in excel, selected items are highlighted in green). The use of more items per facets makes the measurement model of facets more stable and ensures more stable facet correlations that are more likely to replicate across studies with different item sets. The covariance matrix for all 303 items is posted on OSF (web303.N808.cov.dat) so that these results presented below can be reproduced.
Results
Measurement Model
I first constructed a measurement model. The aim was not to test a structural model, but to find a measurement model that can be used to test structural models of personality. Using CFA for exploration seems to contradict its purpose, but reading the original article by Joreskog shows that this approach is entirely consistent with the way he envisoned CFA to be used. It is unclear to me who invented the idea that CFA should follow an EFA analysis. This makes little sense because EFA may not fit some data if there are hierarchical relationships or correlated residuals. So, CFA modelling has to start with a simple theoretical model that then may need to be modified to fit some data, which leads to a new model to be tested with new data.
To develop a measurement model with reasonable fit to the data, I started with a simple model where items had fixed primary loadings and no secondary loadings, while all factors were allowed to be correlated with each other. This is a simple structure model. It is well known that this model does not fit real data. I then modified the model based on modification indices that suggested (a) secondary loadings, (b) relaxed the constraint of a primary loading, or (c) suggested correlated item residuals. This way a model with reasonable fit to the data was obtained, CFI = .775, RMSEA = .040, SRMR = .042 (M0.Measurement.Model.inp on OSF). Although CFI was below the standard criterion of .95, model fit was considered acceptable because the only source of misfit to the model would be additional small secondary loadings (< .2) or correlated residuals that have little influence on the magnitude of the facet correlations.
Facet Correlations
Below I present the correlations among the facets. The full correlation matrix is broken down into sections that are theoretically meaningful. The first five tables show the correlations among facets that share the same Big Five factor.
There are three main neuroticism facets: anxiety, anger/hostility, and depression. A fourth facet was originally intended to be an openness to emotions facet, but it correlated more highly with neuroticism (Schimmack, 2009c). All four facets show positive correlations with each other and most of these correlations are substantial, except the strong emotions and depression facets.
Results for extraversion show that all five facets are positively correlated with each other. All correlations are greater than .3, but none of the correlations are so high as to suggest that they are not distinct facets.
Openness facets are also positively correlated, but some correlations are below .2, and one correlation is only .16, namely the correlation between openness to activities and art.
The correlations among agreeableness facets are more variable and the correlation between modesty and trust is slightly negative, r = -.05. The core facet appears to be caring which shows high correlations with morality and forgiveness.
All correlations among conscientiousness facets are above .2. Self-discipline shows high correlations with competence beliefs and achievement striving.
Overall, these results are consistent with the Big Five model.
The next tables examine correlations among sets of facets belonging to two different Big Five traits. According to Digman and DeYoung’s alpha-beta model, extraversion and openness should be correlated. Consistent with this prediction, the average correlation is r = .16. For ease of interpretation all correlations above .10 are highlighted in grey, showing that most correlations are consistent with predictions. However, the value facet of openness shows lower correlations with extraversion facets. Also, the excitement seeking facet of extraversion is more strongly related to openness facets than other facets.
The alpha-beta model also predicts negative correlations among neuroticism and agreeableness facets. Once more, the average correlation is consistent with this prediction, r = -.15. However, there is also variation in correlations. In particular, the anger facet is more strongly negatively correlated with agreeableness facets than other neuroticism facets.
As predicted by the alpha-beta model, neuroticism facets are negatively correlated with conscientiousness facets, average r = -.21. However, there is variation in these correlations. Anxiety is less strongly negatively correlated with conscientiousness facets than other neuroticism facets. Maybe, anxiety sometimes has similar effects as conscientiousness by motivating people to inhibit approach motivated, impulsive behaviors. In this context, it is noteworthy that I found no strong loading of impulsivity on neuroticism (Schimmack, 2019c).
The last pair are agreeableness and conscientiousness facets, which are predicted to be positively correlated. The average correlation is consistent with this prediction, r = .15.
However, there is notable variation in these correlations. A2-Morality is more strongly positively correlated with agreeableness than other agreeableness facets, in particular trust and modesty which show weak correlations with conscientiousness.
The alpha-beta model also makes predictions about other pairs of Big Five facets. As alpha and beta are conceptualized as independent factors, these correlations should be weaker than those in the previous tables and close to zero. However, this is not the case.
First, the average correlation between neuroticism and extraversion is negative and nearly as strong as the correlation between neuroticism and agreeableness, r = -.14. In particular, depression is strongly negatively related to extraversion facets.
The average correlation between extraversion and agreeableness facets is only r = .07. However, there is notable variability. Caring is more strongly related to extraversion than other agreeableness facets, especially with warmth and cheerfulness. Cheerfulness also tends to be more strongly correlated with agreeableness facets than other extraversion facets.
Extraversion and conscientiousness facets are also positively correlated, r = .15. Variation is caused by stronger correlations for the competence and self-discipline facets of conscientiousness and the activity facet of extraversion.
Openness facets are also positively correlated with agreeableness facets, r = .10. There is a trend for the O1-Imagination facet of openness to be more consistently correlated with agreeableness facets than other openness facets.
Finally, openness facets are also positively correlated with conscientiousness facets, r = .09. Most of this average correlation can be attributed to stronger positive correlations of the O4-Ideas facet with conscientiousness facets.
In sum, the Big Five facets from different Big Five factors are not independent. Not surprisingly, a model with five independent Big Five factors reduced model fit from CFI = .775, RMSEA = .040 to CFI = .729, RMSEA = .043. I then fitted a model that allowed for the Big Five factors to be correlated without imposing any structure on these correlations. This model improved fit over the model with independent dimensions, CFI = .734, RMSEA = .043.
The pattern of correlations is consistent with a general evaluative factor rather than a model with independent alpha and beta factors.
Not surprisingly, fitting the alpha-beta model to the data reduced model fit, CFI = .730, RMSEA = .043. In comparison, a mode with a single evaluative bias factor had better fit, CFI = .732, RMSEA = .043.
In conclusion, the results confirm previous studies that a general evaluative dimension produces correlations among the Big Five factors. DeYoung’s (2006) multi-method study and several other multi-method studies demonstrated that this dimension is mostly rater bias because it shows no convergent validity across raters.
Facet Correlations with Method Factors
To remove the evaluative bias from correlations among facets, it is necessary to model evaluative bias at the item level. That is, all items load on an evaluative bias factor. This way the shared variance among indicators of a facet reflects only facet variance and no evaluative variance. I also included an acquiescence factor, although acquiescence has a negligible influence on facet correlations.
It is not possible to let all facets to be correlated freely when method factors are included in a model because this model is not identified. To allow for a maximum of theoretically important facet correlations, I freed parameters for facets that belong to the same Big Five factor, facets that are predicted to be correlated by the alpha-beta model, and additional correlations that were suggested by modification indices. Loadings on the evaluative bias factor were constraint to 1 unless modification indices suggested that items had stronger or weaker loadings on the evaluative bias factor. This model fitted the data as well as the original measurement model, CFI = .778 vs. 775, RMSEA = .040 vs. .040. Moreover, modification indices did not suggest any further correlations that could e freed to improve model fit.
The main effect of controlling for evaluative bias is that all facet correlations were reduced. However, it is particularly noteworthy to examine the correlations that are predicted by the alpha-beta model.
The average correlation for extraversion and openness facets is r = .07. This average is partially driven by stronger correlations of the excitement seeking facet with openness facets than other excitement facets. There are only four other correlations above .10, and 9 of the 25 correlations are negative. Thus, there is little support for a notable general factor that produces positive correlations between extraversion and openness facets.
The average correlation for neuroticism and agreeableness is r = -.06. However, the pattern shows mostly strong negative correlations for the anger facet of neuroticism with agreeableness facets. In addition, there is a strong positive correlation between anxiety and morality, r = .20. This finding suggests that anxiety may also serve the function to inhibit immoral behavior.
The average correlation for neuroticism and conscientiousness is r = -.07. While there are strong negative correlations, r = -.30 for anger and deliberation, there is also a strong positive correlation, r = .22 for self-discipline and anxiety. Thus, the relationship between neuroticism and conscientiousness facets is complex.
The average correlation for agreeableness and conscientiousness facets is r = .01. Moreover, none of the correlations exceeded r = .10. This finding suggests that agreeableness and conscientiousness are independent Big Five factors, which contradicts the prediction by the alpha-beta model.
The finding also raises questions about the small but negative correlations of neuroticism with agreeableness (r = -.06) and conscientiousness (r = -.07). If these correlations were reflecting the influence of a common factor alpha that influences all three traits, one would expect a positive relationship between agreeableness and conscientiousness. Thus, these relationships may have another origin, or there is some additional negative relationship between agreeableness and conscientiousness that cancels out a potential influence of alpha.
Removing method variance also did not eliminate relationships between facets that are not predicted to be correlated by the alpha-beta model. The average correlation between neuroticism and extraversion facets is r = -.05, which is small, but not notably smaller than the predicted correlations (r = .01 to .07).
Moreover, some of these correlations are substantial. For example, excitement seeking is negatively related to anxiety (r = -.24) and warmth is negatively related to depression (r = -.22). Any structural model of personality structure needs to take these findings into account.
A Closer Examination of Extraversion and Openness
There are many ways to model the correlations among extraversion and openness facets. Here I demonstrate that the correlation between extraversion and openness depends on the modelling of secondary loadings and correlated residuals. The first model allowed for extraversion and openness to be correlated. It also allowed for all openness facets to load on extraversion and for all extraversion facets to load on openness. Residual correlations were fixed to zero. This model is essentially an EFA model.
Model fit was as good as for the baseline model, CFI = .779 vs. 778, RMSEA = .039 vs. .040. The pattern of secondary loadings showed two notable positive loadings. Excitement seeking loaded on openness and open to activities loaded on E. In this model the correlation between extraversion and neuroticism was .08, SE = .17. Thus, the positive correlation in the model without secondary loadings was caused by not modelling the pattern of secondary loadings.
However, it is also possible to fit a model that produces a strong correlation between E and O. To do so, the loadings excitement seeking and openness to actions can be set to zero. This pushes other secondary loadings to be negative, which is compensated by a positive correlation between extraversion and openness. This model has the same overall fit as the previous model, both CFI = .779, both RMSEA = .039, but the correlation between extraversion and openness jumps to r = .70. The free secondary loadings are all negative.
The main point of this analysis is to show the importance of facet correlations for structural theories of personality traits. In all previous studies, including my own, the higher-order structure was examined using Big Five scales. However, the correlation between an Extraversion Scale and an Openness Scale provides insufficient information about the relationship between the Extraversion Factor and the Openness Factor because scales always confound information about secondary loadings, residual correlations, and factor correlations.
The goal for future research is to find ways to test competing structural models. For example, the second model suggests that any interventions that increase extraversion would decrease openness to ideas, while the first model does not make this prediction.
Conclusion
Personality psychologists have developed and tested structural models of personality traits for nearly a century. In the 1980s, the Big Five factors were identified. The Big Five have been relatively robust in future replication attempts and emerged also in this investigation. However, there has been little progress in developing and testing hierarchical models of personality that explain what the Big Five are and how they are related to more specific personality traits called facets. There have also been attempts to find even broader personality dimensions. An influential article by Digman (1997) proposed that a factor called alpha produces correlations among neuroticism, agreeableness, and conscientiousness, while a beta factor links extraversion and openness. As demonstrated before, Digman’s results could not be reproduced and ignored evaluative bias in personality ratings (Anusic et al., 2009). Here, I show that empirical tests of higher-order models need to use a hierarchical CFA model because secondary loadings create spurious correlations among Big Five scales that distort the pattern of correlations among the Big Five factors. Based on the present results, there is no evidence for Digman’s alpha and beta factors.
Psychological science has a replication crisis. Many textbook findings, especially in social psychology, failed to replicate over the past years. The reason for these surprising replication failures is that psychologists have used questionable research practices to produce results that confirm theories rather than using statistical methods to test theories and to let theories fail if the evidence does not support them. However, falsification of theories is a sign of scientific progress and it is time to subject psychological theories to real tests.
In personality psychology, the biggest theory is Big Five theory. In short, Big Five theory postulates that variation in personality across individuals can be described with five broad personality dimensions: neuroticism, extraversion, openness, agreeableness, and conscientiousness. Textbooks also claim that the Big Five are fairly universal and can be demonstrated in different countries and with different languages.
One limitation of these studies is that they often use vague criteria to claim that the Big Five have been found or that personality traits are universal. Psychometricians have developed rigorous statistical methods to test these claims, but these methods are rarely used by personality psychologists to test Big Five theory. Some personality psychologists even claimed that these methods should not be used to test Big Five theory because they fail to support the Big Five (McCrae et al., 1996). I have argued that it is time to test Big Five theory with rigorous methods and to let the data decide whether the Big Five exist or not. Other personality psychologists have also started to subject Big Five theory to more rigorous tests (Soto & John, 2017).
Big Five Theory
Big Five theory does not postulate that there are only five dimensions of personality. Rather, it starts with the observation that many important personality traits have been identified and labeled in everyday life. There are hundreds of words that describe individual differences such as helpful, organized, friendly, anxious, curious, or thoughtful. Big Five theory postulates that these personality traits are systematically related to each other. That is, organized individuals are also more likely to be thoughtful and anxious individuals are also more likely to be irritable and sad. Big Five theory explains these correlations among personality traits with five independent factors; that is some broad personality trait that causes covariations among more specific traits that are often called facets. For example, a general disposition to experience more intense unpleasant feelings may produce correlations among the disposition to experience more anxiety, anger, and sadness.
The main prediction of Big Five theory is that the pattern of correlations among personality traits should be similar across different samples and measurement instruments, and that factor analysis produces the same pattern of correlations.
Testing Big Five Theory
A proper psychometric test of Big Five theory requires a measurement model of the facets. If facets are not measured properly, it is impossible to examine the pattern of correlations among the facets. Thus, a proper test of Big Five theory requires fitting a hierarchical model to personality ratings. The first level of the hierarchy specifies a fairly large number of facets that are supposed to be related to one or more Big Five dimensions. The second level of the hierarchy specifies the Big Five factors so that it is possible to examine the relationships (factor loadings) of the facets on the Big Five factors. At present, very few studies have tried to test Big Five theory with hierarchical models. Soto and John (2017) tested Big Five theory with three facets for each Big Five domain and found reasonably good fit for their hierarchical models (see Figure for their model).
Although Soto and Johns’s (2017) article is a step in the right direction, it does not provide a thorough test of Big Five theory for several reasons. First, the model allows facets to correlate freely rather than testing the prediction that these correlations are produced by a Big Five factor. Second, models with only three indicators have zero degrees of freedom and produce perfect fit to the data. Thus, more than three facets are needed to test the prediction that Big Five factors account for the pattern of correlations among facets. Third, the model was fitted separately for each Big Five domain. Thus, there is no information about the relationship of facets to other Big Five factors. For example, the anger facet of neuroticism tends to show negative loadings on agreeableness. Whether such relationships are consistent across datasets is also important to examine.
In a recent blog post, I presented I tried to fit a Big Five model to the 30 facets of the NEO-PI-R (Schimmack, 2019a). Table 1 shows the factor loadings of the 30 facets on the Big Five factors.
The results were broadly consistent with the theoretical Big Five structure. However, some facets did not show the predicted pattern. For example, excitement seeking did not load on extraversion. Other facets had rather weak loadings. For example, the loading of Impulsivity on neuroticism implies that less than 10% of the variance in impulsivity is explained by neuroticism. These results do not falsify Big Five theory by any means. However, they provide the basis for further theory development and refinement of personality theory. However, before any revisions of Big Five theory are made, it is important to examine the replicability of the factor structure in hierarchical measurement models.
Replication Study
Data
From 2010 to 2012 I posted a personality questionnaire with 303 items on the web. Visitors were provided with feedback about their personality on the Big Five dimensions and the 30 facets. In addition to the items that were used to provide feedback, the questionnaire contained several additional items that might help to improve measurement of facets. Furthermore, the questionnaire included some items about life-satisfaction because I have an interest in the relationship between personality traits and life-satisfaction. The questionnaire also included four questions about desirable attributes, namely attractiveness, intelligence, fitness, and broad knowledge. These questions have been used before to demonstrate evaluative biases in personality ratings (Anusic et al., 2009).
Simple correlations and factor analysis were used to identify three indicators of the 30 NEO-facets. Good indicators should show moderate and similar correlations to each other. During this stage it became apparent that the item-set failed to capture the self-consciousness facet of neuroticism and the dutifulness facet of conscientiousness. Thus, these two facets could not be included in the model.
I first fitted a model that allowed the 28 facets to be correlated freely. This model evaluates the measurement of the 28 facets and provides information about the pattern of correlations among facets that Big Five theory aims to explain. This model showed very high correlations between the neuoroticism-facet anger and the agreeableness-facet compliance (r = .8), the warmth and gregariousness facets of extraversion (r = 1) , and the anxiety and vulnerability facets of neuroticism (r = .8). These correlations raise concerns about the discriminant validity of these facets and create problems in fitting a hierarchical model to the data. Thus, I dropped the vulnerability, gregariousness, and compliance items and facets from the model. Thus, the final model had 83 items, 26 facets, and factors for life-satisfaction and for desirable attributes.
The model fit for the model with correlated factors was accepted considering the RMSEA fit index, but below standard criteria for the CFI. However, examination of the modification indices showed that only freeing weak secondary loadings would further improve model fit. Thus, the model was considered adequate and model fit of this model served as a comparison standard for the hierarchical model, CFI = .867, RMSEA = .037.
The hierarchical model specified the Big Five as independent factors. In addition, it included an acquiescence factor and an evaluative bias factor. The evaluative bias factor was allowed to correlate with the desirable attribute factor (cf. Anusic et al., 2009). Life-satisfaction was regressed on the facets, but only significant facets were retained in the final model. Model fit of this model was comparable to model fit of the baseline model, CFI = .861, RMSEA = .040.
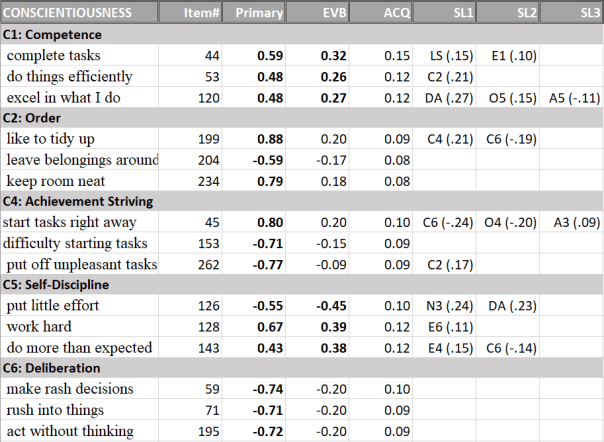
The first set of tables shows the item loadings on the primary factor, the evaluative bias factor, the acquiescence factor, and secondary loadings. Facet names are based on the NEO-PI-R.
Primary loadings of neuroticism items on their facets are generally high and secondary loadings are small (Table 1). Thus, the four neuroticism facets were clearly identified.
The measurement model for the extraversion facets also showed high primary loadings (Table 2).
For openness, one item of the values facet had a low loading, but the other two items clearly identified the facet (Table 3).
All primary loadings for the four agreeableness facets were above .4 and the facets were clearly identified (Table 4).
Finally, the conscientiousness facets were also clearly identified (Table 5).
In conclusion, the measurement model for the 24 facets showed that all facets were measured well and that the item content matches the facet labels. Thus, the basic requirement for examining the structural relationships among facets have been met.
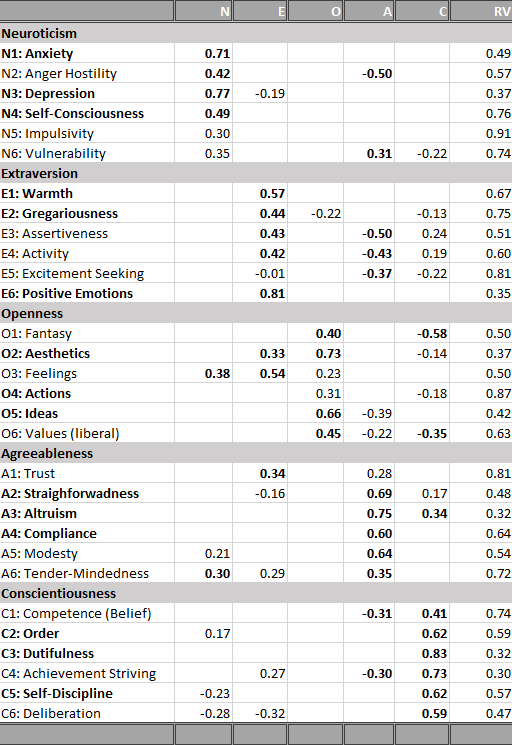
Structural Model
The most important result are the loadings of the 24 facets on the Big Five factors. These results are shown in Table 6. To ease interpretation, primary loadings greater than .4 and secondary loadings greater than .2 are printed in bold. Results that are consistent with the previous study of the NEO-PI-R are highlighted with a gray background.
15 of the 24 primary loadings are above .4 and replicate results with the NEO-PI-R. This finding provides support for the Big Five model.
There are also four consistent loadings below .4, namely for the impulsivity facet of neuroticism, the openness facets feelings and actions, and the agreeableness facet of trust. This finding suggests that the model needs to be revised. Either there are measurement problems or openness is not related to emotions and actions. Problems with agreeableness have led to the creation of an alternative model with six factors (Ashton & Lee) that distinguishes two aspects of agreeableness.
There are eight facets with inconsistent loading patterns. Activity loaded with .34 on extraversion. More problematic was the high secondary loading on conscientiousness, suggesting that activity level is not clearly related to a single Big Five trait. The results for excitement seeking were particularly different. Excitement seeking did not load at all on extraversion in the NEO-PI-R model, but the loading in this sample was high.
The loading for values on openness was .45 for the NEO-PI-R and .29 in this sample. Thus, the results are more consistent than the use of the arbitrary .4 value suggests. Values are related to openness, but the relationship is weak and openness explains no more than 20% of the variance in holding liberal versus conservative values.
For agreeableness, compliance was represented by the anger facet of neuroticism, which did not load above .4 on agreeableness although the loading came close (-.32). Thus, the results do not require a revision of the model based on the present data. The biggest problem was that the modesty facet did not load highly on the agreeableness facet (.21). More research is needed to examine the relationship between modesty and agreeableness.
Results for conscientiousness were fairly consistent with theory and the loading of the deliberation facet on conscientiousness was just shy of the arbitrary .4 criterion (.37). Thus, no revision to the model is needed at this point.
The consistent results provide some robust markers of the Big Five, that is facets with high primary and low secondary loadings. Neuroticism is most clearly related to high anxiety and high vulnerability (sensitivity to stress), which could not be distinguished in the present dataset. However, other negative emotions like anger and depression are also consistently related to neuroticism. This suggests that neuroticism is a general disposition to experience more unpleasant emotions. Based on structural models of affective experiences, this dimension is related to Negative Activation and tense arousal.
Extraversion is consistently related to warmth and gregariousness, which could not be separated in the present dataset as well as assertiveness and positive emotions. One interpretation of this finding is that extraversion reflects positive activation or energetic arousal, which is a distinct affective system that has been linked to approach motivation. Structural analyses of affect also show that tense arousal and energetic arousal are two separate dimensions. The inconsistent results for action may reflect the fact that activity levels can also be influenced by more effortful forms of engagement that are related to conscientiousness. Extraverted activity might be more intrinsically motivated by positive emotions, whereas conscientious activity is more driven by extrinsic motivation.
The core facets of openness are fantasy/imagination, artistic interests, and intellectual engagement. The common feature of these facets is that attention is directed. The mind is traveling rather than being focused on the immediate situation. A better way to capture openness to feelings might be to distinguish feelings that arise from actual events versus emotions that are elicited by imagined events or art.
The core features of agreeableness are straighforwardness, altruism, and tender-mindedness, which could not be separated from altruism in this dataset. The common feature is a concern about the well-being of others versus a focus on the self. Trust may not load highly on agreeableness because the focus of trust is individuals own well-being. Trusting others may be beneficial for the self if others are trustworthy or harmful if they are not. However, it is not necessary to trust somebody in need to help them unless helping is risky.
The core feature of conscientiousness is self-discipline. Order and achievement striving (which is not the best label for this facet) also imply that conscientious people can stay focused on things that need to be done and are not easily distracted. Conscientious people are more likely to follow a set of rules.
There are only a few consistent secondary loadings. This suggest that many secondary loadings may be artifacts of item-selection or participant selection. The few consistent secondary loadings make theoretical sense. Anger loads negatively on agreeableness and this facet is probably best considered a blend of high neuroticism and low agreeableness.
Assertiveness shows a positive loading on conscientiousness. The reason is that conscientious people may have a strong motivation to follow their internal norms (a moral compass) and that they are wiling to assert these norms if necessary.
The openness to feelings facet has a strong “secondary” loading on neuroticism, suggesting that this facet does not measure what it was intended to measure. It just seems to be another measure of strong feelings without specifying the valence.
Finally, deliberation is negatively related to extraversion. This finding is consistent with the speculation that extraversion is related to approach motivation. Extraverts are more likely to give in to temptations, whereas conscientious individuals are more likely to resist temptations. In this context, the results for impulsivity are also noteworthy. At least in this dataset, implusive behaviors that were mostly related to eating were more strongly related to extraversion than to neuroticism. If neuroticism is strongly related to anxiety and avoidance behavior, it is not clear why neurotic individuals would be more impulsive. However, if extraversion reflects approach motivation, it makes more sense that extraverts are more likely to indulge.
Of course, these interpretations of the results are mere speculations. In fact, it is not even clear that the Big Five account for the correlations among facets. Some researchers have proposed that facets may directly influence each other. While this is possible, such models will have to explain the consistent pattern of correlations among facets. The present results are at least consistent with the idea that five broader dispositions explain some of these correlations.
Neuroticism is a broad disposition to experience a range of unpleasant emotions, not just anxiety.
Extraversion is a broad disposition to be actively and positively engaged.
Openness is a broad disposition to focus on internal processes (thoughts and feelings) rather than on external events and doing things.
Agreeableness is a broad disposition to be concerned with the well-being of others as opposed to being only concerned with oneself.
Conscientiousness is a broad disposition to be guided by norms and rules as opposed to being guided by momentary events or impulses.
While these broad dispositions account for some of the variance in specific personality traits, facets, facets add additional information that is not captured by the Big Five. The last column in Table 1 shows the residual (i.e., unexplained) variances in the facets. While the amount of unepxlained variance varies considerable across facets, the average is high (57%) and this estimate is consistent with the estimate in the NEO-PI-R (58%). Thus, the Big Five provide only a very broad and unclear impression of individuals’ personality.
Residual Correlations among Facets
Traditional factor analysis does not allow for correlations among the residual variances of indicators. CFA models that do not include these correlations have poor fit. I was only able to produce reasonable fit to the NEO-PI-R data by including correlated residuals in the model. This was also the case for this dataset. Table 7 shows the residual correlations. For the ease of interpretation, residual correlations that were consistent across models are highlighted in green.
As can be seen, most of the residual correlations were inconsistent across datasets. This shows that the structure of facet correlations is not stable across these two datasets. This complicates the search for a structural model of personality because it will be necessary to uncover moderators of these inconsistencies.
Life Satisfaction
While dozens of articles have correlated Big Five measures with life-satisfaction scales, few studies have examined how facets are related to life-satisfaction (Schimmack, Oishi, Furr & Funder, 2004). The most consistent finding has been that the depression facet explains unique variance above and beyond neuroticism. This was also the case in this dataset. Depression was by far the strongest predictor of life-satisfaction (-.56). The only additional significant predictor that was added to the model was the competence facet (.22). Contrary to previous studies, the cheerfulness facet did not predict unique variance in life-satisfaction judgments. More research at the facet level and with other specific personality traits below the Big Five is needed. However, the present results confirm that facets contain unique information that contributes to the prediction of outcome variables. This is not surprising given the large amount of unexplained variance in facets.
Desirable Attributes
Table 8 shows the loadings of the four desirable attributes on the DA factor. Loadings are similar to those in Anusic et al. (2009). As objective correlations among these characteristics are close to zero, the shared variance can be interpreted as an evaluative bias. Items did not load on the evaluative bias factor to examine the relationship with the evaluative bias factor at the factor level.
Unexpectedly, the DA factor correlated only modestly with the evaluative bias factor for the facet-items, r = .38. This correlation is notably weaker than the correlation reported by Anusic et al. (2009), r = .76. This raises some questions about the nature of the evaluative bias variance. It is unfortunate that we do not know more about this persistent variance in personality ratings, one-hundred years after Thorndike (1920) first reported it.
Conclusion
In an attempt to replicate a hierarchical model of personality, I was only partially successful to cross-validate the original model. On the positive side, 15 out of 24 distinct facets had loadings on the predicted Big Five factor. This supports the Big Five as a broad model of personality. However, I also replicated some results that question the relationship between some facets and Big Five factors. For example, impulsiveness does not seem to be a facet of neuroticism and openness to actions may not be a facet of openness. Moreover, there were many inconsistent results that suggest the structure of personality is not as robust as one might expect. More research is needed to identify moderators of facet correlations. For example, in student samples anxiety may be a positive predictor of achievement striving, whereas it may be unrelated or negatively related to achievement striving in middle or old age.
Past research with exploratory methods has also ignored that the Big Five do not explain all of the correlations among facets. However, these correlations also seem to vary across samples.
All of these results do not make for neat and sexy JPSP article that proposes a simple model of personality structure, but the present results do suggest that one should not trust such simple models because personality structure is much more complex and unstable than these models suggest.
I can only repeat that personality research will only make progress by using proper methods that can actually test and falsify structural models. Falsification of simple and false models is the impetus for theory development. Thus, for the sake of progress, I declare that the Big Five model that has been underpinning personality research for 40 needs to be revised. Most importantly, progress can only be made if personality measures do not already assume that the Big Five are valid. Measures like the BFI-2 (Soto & John) or the NEO-PI-R have the advantage that they capture a wide range of personality differences at the facet level. Surely there are more than 15, 24, or 30 facets. So more research about personality at the facet level is required. Personality research might also benefit from a systematic model that integrates the diverse range of personality measures that have been developed for specific research questions from attachment styles to machiavellianism. All of this research would benefit from the use of structural equation modeling because SEM can fit a diverse range of models and provides information of model fit.
Galileo had the clever idea to turn a microscope into a telescope and to point it towards the night sky. His first discovery was that Jupiter had four massive moons that are now known as the Galilean moons (Space.com).
Now imagine what would have happened if Galileo had an a priori theory that Jupiter has five moons and after looking through the telescope, Galileo decided that the telescope was faulty because he could see only four moons. Surely, there must be five moons and if the telescope doesn’t show them, it is a problem of the telescope. Astronomers made progress because they created credible methods and let empirical data drive their theories. Eventually even better telescopes discovered many more, smaller moons orbiting around Jupiter. This is scientific progress.
Alas, psychologists don’t follow the footsteps of natural sciences. They mainly use the scientific method to provide evidence that confirms their theories and dismiss or hide evidence that disconfirms their theories. They also show little appreciation for methodological improvements and often use methods that are outdated. As a result, psychology has made little progress in developing theories that rest of solid empirical foundations.
An example of this ill-fated approach to science is McCrae et al.’s (1996) attempt to confirm their five factor model with structural equation modeling (SEM). When they failed to find a fitting model, they decided that SEM is not an appropriate method to study personality traits because SEM didn’t confirm their theory. One might think that other personality psychologists realized this mistake. However, other personality psychologists were also motivated to find evidence for the Big Five. Personality psychologists had just recovered from an attack by social psychologists that personality traits does not even exist, and they were all too happy to rally around the Big Five as a unifying foundation for personality research. Early warnings were ignored (Block, 1995). As a result, the Big Five have become the dominant model of personality without subjecting the theory to rigorous tests and even dismissing evidence that theoretical models do not fit the data (McCrae et al., 1996). It is time to correct this and to subject Big Five theory to a proper empirical test by means of a method that can falsify bad models.
I have demonstrated that it is possible to recover five personality factors, and two method factors, from Big Five questionnaires (Schimmack, 2019a, 2019b, 2019c). These analyses were limited by the fact that the questionnaires were designed to measure the Big Five factors. A real test of Big Five theory requires to demonstrate that the Big Five factors explain the covariations among a large set of a personality traits. This is what McCrae et al. (1996) tried and failed to do. Here I replicate their attempt to fit a structural equation model to the 30 personality traits (facets) in Costa and McCrae’s NEO-PI-R.
In a previous analysis I was able to fit an SEM model to the 30 facet-scales of the NEO-PI-R (Schimmack, 2019d). The results only partially supported the Big Five model. However, these results are inconclusive because facet-scales are only imperfect indicators of the 30 personality traits that the facets are intended to measure. A more appropriate way to test Big Five theory is to fit a hierarchical model to the data. The first level of the hierarchy uses items as indicators of 30 facet factors. The second level in the hierarchy tries to explain the correlations among the 30 facets with the Big Five. Only structural equation modeling is able to test hierarchical measurement models. Thus, the present analyses provide the first rigorous test of the five-factor model that underlies the use of the NEO-PI-R for personality assessment.
The complete results and the MPLUS syntax can be found on OSF (https://osf.io/23k8v/). The NEO-PI-R data are from Lew Goldberg’s Eugene-Springfield community sample. Theyu are publicly available at the Harvard Dataverse.
Results
Items
The NEO-PI-R has 240 items. There are two reasons why I analyzed only a subset of items. First, 240 variables produce 28,680 covariances, which is too much for a latent variable model, especially with a modest sample size of 800 participants. Second, a reflective measurement model requires that all items measure the same construct. However, it is often not possible to fit a reflective measurement model to the eight items of a NEO-facet. Thus, I selected three core-items that captured the content of a facet and that were moderately positively correlated with each other after reversing reverse-scored items. Thus, the results are based on 3 * 30 = 90 items. It has to be noted that the item-selection process was data-driven and needs to be cross-validated in a different dataset. I also provide information about the psychometric properties of the excluded items in an Appendix.
The first model did not impose a structural model on the correlations among the thirty facets. In this model, all facets were allowed to correlate freely with each other. A model with only primary factor loadings had poor fit to the data. This is not surprising because it is virtually impossible to create pure items that reflect only one trait. Thus, I added secondary loadings to the model until acceptable model fit was achieved and modification indices suggested no further secondary loadings greater than .10. This model had acceptable fit, considering the use of single-items as indicators, CFI = .924, RMSEA = .025, .035. Further improvement of fit could only be achieved by adding secondary loadings below .10, which have no practical significance. Model fit of this baseline model was used to evaluate the fit of a model with the Big Five factors as second-order factors.
To build the actual model, I started with a model with five content factors and two method factors. Item loadings on the evaluative bias factor were constrained to 1. Item loadings for on the acquiescence factor were constrained to 1 or -1 depending on the scoring of the item. This model had poor fit. I then added secondary loadings. Finally, I allowed for some correlations among residual variances of facet factors. Finally, I freed some loadings on the evaluative bias factor to allow for variation in desirability across items. This way, I was able to obtain a model with acceptable model fit, CFI = .926, RMSEA = .024, SRMR = .045. This model should not be interpreted as the best or final model of personality structure. Given the exploratory nature of the model, it merely serves as a baseline model for future studies of personality structure with SEM. That being said, it is also important to take effect sizes into account. Parameters with substantial loadings are likely to replicate well, especially in replication studies with similar populations.
Item Loadings
Table 1 shows the item-loadings for the six neuroticism facets. All primary loadings exceed .4, indicating that the three indicators of a facet measure a common construct. Loadings on the evaluative bias factors were surprisingly small and smaller than in other studies (Anusic et al., 2009; Schimmack, 2009a). It is not clear whether this is a property of the items or unique to this dataset. Consistent with other studies, the influence of acquiescence bias was weak (Rorer, 1965). Secondary loadings also tended to be small and showed no consistent pattern. These results show that the model identified the intended neuroticism facet-factors.
Table 2 shows the results for the six extraversion facets. All primary factor loadings exceed .40 and most are more substantial. Loadings on the evaluative bias factor tend to be below .20 for most items. Only a few items have secondary loadings greater than .2. Overall, this shows that the six extraversion facets are clearly identified in the measurement model.
Table 3 shows the results for Openness. Primary loadings are all above .4 and the six openness factors are clearly identified.
Table 4 shows the results for the agreeableness facets. In general, the results also show that the six factors represent the agreeableness facets. The exception is the Altruism facet, where only two items show a substantial loadings. Other items also had low loadings on this factor (see Appendix). This raises some concerns about the validity of this factor. However, the high-loading items suggest that the factor represents variation in selfishness versus selflessness.
Table 5 shows the results for the conscientiousness facets. With one exception, all items have primary loadings greater than .4. The problematic item is the item “produce and common sense” (#5) of the competence facet. However, none of the remaining five items were suitable (Appendix).
In conclusion, for most of the 30 facets it was possible to build a measurement model with three indicators. To achieve fit, the model included 76 out of 2,610 (3%) secondary loadings. Many of these secondary loadings were between .1 and .2, indicating that they have no substantial influence on the correlations of factors with each other.
Facet Loadings on Big Five Factors
Table 6 shows the loadings of the 30 facets on the Big Five factors. Broadly speaking the results provide support for the Big Five factors. 24 of the 30 facets (80%) have a loading greater than .4 on the predicted Big Five factor, and 22 of the 30 facets (73%) have the highest loading on the predicted Big Five factor. Many of the secondary loadings are small (< .3). Moreover, secondary loadings are not inconsistent with Big Five theory as facet factors can be related to more than one Big Five factor. For example, assertiveness has been related to extraversion and (low) agreeableness. However, some findings are inconsistent with McCrae et al.’s (1996) Five factor model. Some facets do not have the highest loading on the intended factor. Anger-hostility is more strongly related to low agreeableness than to neuroticism (-.50 vs. .42). Assertiveness is also more strongly related to low agreeableness than to extraversion (-.50 vs. .43). Activity is nearly equally related to extraversion and low agreeableness (-.43). Fantasy is more strongly related to low conscientiousness than to openness (-.58 vs. .40). Openness to feelings is more strongly related to neuroticism (.38) and extraversion (.54) than to openness (.23). Finally, trust is more strongly related to extraversion (.34) than to agreeableness (.28). Another problem is that some of the primary loadings are weak. The biggest problem is that excitement seeking is independent of extraversion (-.01). However, even the loadings for impulsivity (.30), vulnerability (.35), openness to feelings (.23), openness to actions (.31), and trust (.28) are low and imply that most of the variance in this facet-factors is not explained by the primary Big Five factor.
The present results have important implications for theories of the Big Five, which differ in the interpretation of the Big Five factors. For example, there is some debate about the nature of extraversion. To make progress in this research area it is necessary to have a clear and replicable pattern of factor loadings. Given the present results, extraversion seems to be strongly related to experiences of positive emotions (cheerfulness), while the relationship with goal-driven or reward-driven behavior (action, assertiveness, excitement seeking) is weaker. This would suggest that extraversion is tight to individual differences in positive affect or energetic arousal (Watson et al., 1988). As factor loadings can be biased by measurement error, much more research with proper measurement models is needed to advance personality theory. The main contribution of this work is to show that it is possible to use SEM for this purpose.
The last column in Table 6 shows the amount of residual (unexplained) variance in the 30 facets. The average residual variance is 58%. This finding shows that the Big Five are an abstract level of describing personality, but many important differences between individuals are not captured by the Big Five. For example, measurement of the Big Five captures very little of the personality differences in Excitement Seeking or Impulsivity. Personality psychologists should therefore reconsider how they measure personality with few items. Rather than measuring only five dimensions with high reliability, it may be more important to cover a broad range of personality traits at the expense of reliability. This approach is especially recommended for studies with large samples where reliability is less of an issue.
Residual Facet Correlations
Traditional factor analysis can produce misleading results because the model does not allow for correlated residuals. When such residual correlations are present, they will distort the pattern of factor loadings; that is, two facets with a residual correlation will show higher factor loadings. The factor loadings in Table 6 do not have this problem because the model allowed for residual correlations. However, allowing for residual correlations can also be a problem because freeing different parameters can also affect the factor loadings. It is therefore crucial to examine the nature of residual correlations and to explore the robustness of factor loadings across different models. The present results are based on a model that appeared to be the best model in my explorations. These results should not be treated as a final answer to a difficult problem. Rather, they should encourage further exploration with the same and other datasets.
Table 7 shows the residual correlation. First appear the correlations among facets assigned to the same Big Five factor. These correlations have the strongest influence on the factor loading pattern. For example, there is a strong correlation between the warmth and gregariousness facets. Removing this correlation would increase the loadings of these two facets on the extraversion factor. In the present model, this would also produce lower fit, but in other models this might not be the case. Thus, it is unclear how central these two facets are to extraversion. The same is also true for anxiety and self-consciousness. However, here removing the residual correlation would further increase the loading of anxiety, which is already the highest loading facet. This justifies the use of anxiety as the most commonly used indicator of neuroticism.
Table 7. Residual Factor Correlations
It is also interesting to explore the substantive implications of these residual correlations. For example, warmth and gregariousness are both negatively related to self-consciousness. This suggests another factor that influences behavior in social situations (shyness/social anxiety). Thus, social anxiety would be not just high neuroticism and low extraversion, but a distinct trait that cannot be reduced to the Big Five.
Other relationships are make sense. Modesty is negatively related to competence beliefs; excitement seeking is negatively related to compliance, and positive emotions is positively related to openness to feelings (on top of the relationship between extraversion and openness to feelings).
Future research needs to replicate these relationships, but this is only possible with latent variable models. In comparison, network models rely on item levels and confound measurement error with substantial correlations, whereas exploratory factor analysis does not allow for correlated residuals (Schimmack & Grere, 2010).
Conclusion
Personality psychology has a proud tradition of psychometric research. The invention and application of exploratory factor analysis led to the discovery of the Big Five. However, since the 1990s, research on the structure of personality has been stagnating. Several attempts to use SEM (confirmatory factor analysis) in the 1990s failed and led to the impression that SEM is not a suitable method for personality psychologists. Even worse, some researchers even concluded that the Big Five do not exist and that factor analysis of personality items is fundamentally flawed (Borsboom, 2006). As a result, personality psychologists receive no systematic training in the most suitable statistical tool for the analysis of personality and for the testing of measurement models. At present, personality psychologists are like astronomers who have telescopes, but don’t point them to the stars. Imagine what discoveries can be made by those who dare to point SEM at personality data. I hope this post encourages young researchers to try. They have the advantage of unbelievable computational power, free software (lavaan), and open data. As they say, better late than never.
Appendix
Running the model with additional items is time consuming even on my powerful computer. I will add these results when they are ready.
Any mature science classifies the objects that it studies. Chemists classify atoms. Biologists classify organisms. It is therefore not surprising that personalty psychologists have spent a lot of their effort on classifying personality traits; that is psychological attributes that distinguish individuals from each other.
[It is more surprising that social psychologists have spent very little effort on classifying situations; a task that is now being carried out by personality psychologists (Rauthmann et al., 2014)]
After decades of analyzing correlations among self-ratings of personality items, personality psychologists came to a consensus that five broad factors can be reliably identified. Since the 1980s, the so-called Big Five have dominated theories and measurement of personality. However, most theories of personality also recognize that the Big Five are not a comprehensive description of personality. That is, unlike colors that can be produced by mixing three basic colors, specific personality traits are not just a mixture of the Big Five. Rather, the Big Five represent an abstract level in a hierarchy of personality traits. It is possible to compare the Big Five to the distinction of five classes of vertebrate animals: mammals, birds, reptiles, fish, and amphibians. Although there are important distinctions between these groups, there are also important distinctions among the animals within each class; cats are not dogs.
Although the Big Five are a major achievement in personality psychology, it also has some drawbacks. As early as 1995, personality psychologists warned that focusing on the Big Five would be a mistake because the Big Five are too broad to be good predictors of important life outcomes (Block, 1995). However, this criticism has been ignored and many researchers seem to assume that they measure personality when they administer a Big Five questionnaire. To warrant the reliance on the Big Five would require that the Big Five capture most of the meaningful variation in personality. In this blog post, I use open data to test this implicit assumption that is prevalent in contemporary personality science.
Confirmatory Factor Analysis
In 1996, McCrae et al. (1995) published an article that may have contributed to the stagnation in research on the structure of personality. In this article, the authors argued that structural equation modeling (SEM), specifically confirmatory factor analysis (CFA), is not suitable for personality researchers. However, CFA is the only method that can be used to test structural theories and to falsify structural theories that are wrong. Even worse, McCrae et al. (1995) demonstrated that a simple-structure model did not fit their data. However, rather than concluding that personality structure is not simple, they concluded that CFA is the wrong method to study personality traits. The problem with this line of reasoning is self-evident and was harshly criticized by Borsboom (2006). If we dismiss methods because they do not show a theoretically predicted pattern, we loose the ability to test theories empirically.
To understand McCrae et al.’s (1995) reaction to CFA, it is necessary to understand the development of CFA and how it was used in psychology. In theory, CFA is a very flexible method that can fit any dataset. The main empirical challenge is to find plausible models and to find data that can distinguish between competing plausible models. However, when CFA was introduced, certain restrictions were imposed on models that could be tested. The most restrictive model imposed that a measurement model should have only primary loadings and no correlated residuals. Imposing these restrictions led to the foregone conclusions that the data are inconsistent with the model. At this point, researchers were supposed to give up, create a new questionnaire with better items, retest it with CFA and find out that there were still secondary loadings that produced poor fit to the data. The idea that actual data could have a perfect structure must have been invented by an anal-retentive statistician who never analyzed real data. Thus, CFA was doomed to be useless because it could only show that data do not fit a model.
It took some time and courage to decide that the straight-jacket of simple structure has to go. Rather than giving up after a simple-structure model was rejected, the finding should encourage further exploration of the data to find models that actually fit the data. Maybe biologists initially classified whales as fish, but so what. Over time, further testing suggested that they are mammals. However, if we never get started in the first place, we will never be able to develop a structure of personality traits. So, here I present a reflective measurement model of personality traits. I don’t call it CFA, because I am not confirming anything. I also don’t call it EFA because this term is used for a different statistical technique that imposes other restrictions (e.g., no correlated residuals, local independence). We might call it exploratory modeling (EM) or because it relies on structural equation modeling, we could call it ESEM. However, ESEM is already been used for a blind computer-based version of CFA. Thus, the term EM seems appropriate.
The Big Five and the 30 Facets
Costa and McCrae developed a personality questionnaire that assesses personality at two levels. One level are the Big Five. The other level are 30 more specific personality traits.
The 30 facets are often presented as if they are members of a domain, just like dogs, cats, pigs, horses, elephants, and tigers are mammals and have nothing to do with reptiles or bird. However, this is an oversimplification. Actual empirical data show that personality structure is more complex and that specific facets can be related to more than one Big Five factor. In fact, McCrae et al. (1996) published the correlations of the 30 facets with the Big Five factors and the table shows many, and a few substantial, secondary loadings; that is, correlations with a factor other than the main domain. For example, Impulsive is not just positively related to Neuroticism. It is also positively related to extraversion, and negatively related to conscientiousness.
Thus, McCrae et al.’s (1996) results show that Big Five data do not have a simple structure. It is therefore not clear what model a CONFIRMATORY factor analysis tries to confirm, when the CFA model imposes a simple structure. McCrae et al. (1995) agree: “If, however, small loadings are in fact meaningful, CFA with a simple structure model may not fit well” (p. 553). In other words, if an exploratory factor analysis shows a secondary loading of Anger/Hostility on Agreeableness (r = -.40), indicating that agreeable people are less likely to get angry, it makes no sense to confirm a model that sets this parameter to zero. McCrae et al. also point out that simple structure makes no theoretical sense for personality traits. “There is no theoretical reason why traits should not have meaningful loadings on three, four, or five factors:” (p. 553). The logical consequence of this insight is to fit models that allow for meaningful secondary loadings; not to dismiss modeling personality data with structural equations.
However, McCrae et al. (1996) were wrong about the correct way of modeling secondary loadings. “It is possible to make allowances for secondary loadings in CFA by fixing the loadings at a priori values other than zero” (p. 553). Of course, it is possible to fix loadings to a non-zero value, but even for primary loadings, the actual magnitude of a loading is estimated by the data. It is not clear why this approach could not be used for secondary loadings. It is only impossible to let all secondary loadings to be freely estimated, but there is no need to fix the loading of anger/hostilty on the agreeableness factor to a fixed value to model the structure of personality.
Personality psychologists in the 1990s also seemed to not fully understand how sensitive SEM is to deviations between model parameters and actual data. McCrae et al. (1996) critically discuss a model by Church and Burke (1994) because it “regarded loadings as small as ± .20 as salient secondaries” (p. 553). However, fixing a loading of .20 to a value of 0, introduces a large discrepancy that will hurt overall fit. One either has to free parameters or lower the criterion for acceptable fit. However, fixing loadings greater than .10 to zero and hoping to met standard criteria of acceptable fit is impossible. Effect sizes of r = .2 (d = .4) are not zero, and treating them as such will hurt model fit.
In short, exploratory studies of the relationship between the Big Five and facets show a complex pattern with many non-trivial (r > .1) secondary loadings. Any attempt to model these data with SEM needs to be able to account for this finding. As many of these secondary loadings are theoretically expected and replicable, allowing for these secondary loadings makes theoretical sense and cannot be dismissed as overfitting of data. Rather, imposing a simple structure that makes no theoretical sense should be considered underfiting of the data, which of course results in bad fit.
Correlated Residuals are not Correlated Errors
Another confusion in the use of structural equation modeling is the interpretation of residual variances. In the present context, residuals represent the variance in a facet scale that is not explained by the Big Five factors. Residuals are interesting for two reasons. First, they provide information about unique aspects of personality that are not explained by the Big Five. To use the analogy of animals, although cats and dogs are both animals, they also have distinct features. Residuals are analogous to these distinct features, and we would think that personality psychologists would be very interested in exploring this question. However, statistics textbooks tend to present residual variances as error variance in the context of measurement models where items are artifacts that were created to measure a specific construct. As the only purpose of the item is to measure a construct, any variance that does not reflect the intended construct is error variance. If we were only interested in measuring the Big Five, we would think about residual facet-variance as error variance. It does not matter how depressed people are. We only care about their neuroticism. However, the notion of a hierarchy implies that we do care about the valid variance in facets that is not explained by the Big Five. Thus, residual variance is not error variance.
The mistake of treating residual variance as error variance becomes especially problematic when residual variance in one facet is related to residual variance in another facet. For example, how angry people get (the residual variance in anger) could be related to how compliant people are (the residual variance in compliance). After all, anger could be elicit by a request to comply to some silly norms (e.g., no secondary loadings) that make no sense. There is no theoretical reason, why facets could only be linked by means of the Big Five. In fact, a group of researchers has attempted to explain all relations among personality facet without the Big Five because they don’t belief in broader factors (cf. Schimmack, 2019b). However, this approach has difficulties explaining the constistent primary loadings of facets on their predicted Big Five factor.
The confusion of residuals with errors accounts at least partially for McCrae et al.’s (1996) failure to fit a measurement model to the correlations among the 30 facets.
“It would be possible to specify a correlated error term between these two scales, but the interpretation of such a term is unclear. Correlated error usually refers to a nonsubstantive source of variance. If Activity and Achievement Striving were, say, observer ratings, whereas all other variables were self-reports, it would make sense to control for this difference in method by introducing a correlated error term. But there are no obvious sources of correlated error among the NEO-PI-R facet scales in the present study” (p. 555).
The Big Five Are Independent Factors, but Evaluative Bias produces correlations among Big Five Scales
Another decision researchers have to make is whether they specify models with independent factors or whether they allow factors to be correlated. That is, are extraversion and openness independent factors or are extraversion and openness correlated. A model with correlated Big Five factors has 10 additional free parameters to fit the data. Thus, the model will is likely to fit better than a model with independent factors. However, the Big Five were discovered using a method that imposed independence (EFA and Varimax rotation). Thus, allowing for correlations among the factors seems atheoretical, unless an explanation for these correlations can be found. On this front, personality researchers have made some progress by using multi-method data (self-ratings and ratings by informants). As it turns out, correlations among the Big Five are only found in ratings by a single rater, but not in correlations across raters (e.g., self-rated Extraversion and informant-rated Agreeableness). Additional research has further validated that most of this variance reflects response styles in ratings by a single rater. These biases can be modeled with two method factors. One factor is an acquiescence factor that leads to higher or lower ratings independent of item content. The other factor is an evaluative bias (halo) factor. It represent responses to the desirability of items. I have demonstrated in several datasets that it is possible to model the Big Five as independent factors and that correlations among Big Five Scales are mostly due to the contamination of scale scores with evaluative bias. As a result, neuroticism scales tend to be negatively related to the other scales because neuroticism is undesirable and the other traits are desirable (see Schimmack, 2019a). Although the presence of evaluative biases in personality ratings has been known for decades, previous attempts at modeling Big Five data with SEM often failed to specify method factors; not surprisingly they failed to find good fit (McCrae et al., 1996. In contrast, models with method factors can have good fit (Schimmack, 2019a).
Other Problems in McCrae et al.’s Attempt
There are other problems with McCrae et al.’s (1996) conclusion that CFA cannot be used to test personality structure. First, the sample size was small for a rigorous study of personality structure with 30 observed variables (N = 229). Second, the evaluation of model fit was still evolving and some of the fit indices that they reported would be considered acceptable fit today. Most importantly, an exploratory Maximum Likelihood model produced reasonable fit, chi2/df = 1.57, RMS = .04, TLI = .92, CFI = .92. Their best fitting CFA model, however, did not fit the data. This merely shows a lack of effort and not the inability of fitting a CFA model to the 30 facets. In fact, McCrae et al. (1996) note “a long list of problems with the technique [SEM], ranging from technical difficulties in estimation of some models to the cost in time and effort involved.” However, no science has made progress by choosing cheap and quick methods over costly and time-consuming methods simply because researchers lack the patients to learn a more complex method. I have been working on developing measurement models of personality for over a decade (Anusic et al., 2009). I am happy to demonstrate that it is possible to fit an SEM model to the Big Five data, to separate content variance from method variance, and to examine how big the Big Five factors really are.
The Data
One new development in psychology is that data are becoming more accessible and are openly shared. Low Goldberg has collected an amazing dataset of personality data with a sample from Oregon (the Eugene-Springfield community sample). The data are now publicly available at the Harvard Dataverse. With N = 857 participants the dataset is nearly four times larger than the dataset used by McCrae et al. (1996), and the ratio 857 observations and 30 variables (28:1) is considered good for structural equation modeling.
It is often advised to use different samples for exploration and then for cross-validation. However, I used the full sample for a mix of confirmation and exploration. The reason is that there is little doubt about the robustness of the data structure (the covariance/correlation matrix). The bigger issue is that a well-fitting model does not mean that it is the right model. Alternative models could also account for the same pattern of correlations. Cross-validation does not help with this bigger problem. The only way to address this is a systematic program of research that develops and tests different models. I see the present model as the beginning of such a line of research. Other researchers can use the same data to fit alternative models and they can use new data to test model assumptions. The goal is merely to boot a new era of research on the structure of personality with structural equation modeling, which could have started 20 years ago, if McCrae et al. (1996) had been more positive about the benefits of testing models and being able to falsify them (a.k.a. doing science).
Results
I started with a simple model that had five independent personality factors (the Big Five) and an evaluative bias factor. I did not include an acquiescence factor because facets are measured with scales that include reverse scored items. As a result, acquiescence bias is negligible (Schimmack, 2019a).
In the initial model facet loadings on the evaluative bias factor were fixed at 1 or -1 depending on the direction or desirability of a facet. This model had poor fit. I then modified the model by adding secondary loadings and by freeing loadings on the evaluative bias factor to allow for variation in desirability of facets. For example, although agreeableness is desirable, the loading for the modesty facet actually turned out to be negative. I finally added some correlated residuals to the model. The model was modified until it reached criteria of acceptable fit, CFI = .951, RMSEA = .044, SRMR = .034. The syntax and the complete results can be found on OSF (https://osf.io/23k8v/).
Table 3 shows the standardized loadings of the 30 facets on the Big Five and the two method factors.
There are several notable findings that challenge prevalent conceptions of personality.
The Big Five are not so big
First, the loadings of facets on the Big Five factors are notably weaker than in McCrae et al.’s Table 4 reproduced above (Table 2). There are two reasons for this discrepancy. First, often evaluative bias is shared between facets that belong to the same factor. For example, anxiety and depression have strong negative loadings on the evaluative bias factor. This shared bias will push up the correlation between the two facets and inflate factor loadings in a model without an evaluative bias factor. Another reason can be correlated residuals. If this extra shared variance is not modeled it pushes up loadings of these facets on the shared factor. The new and more accurate estimates in Table 3 suggest that the Big Five are not as big as the name implies. The loading of anxiety on neuroticism (r = .49) implies that only 25% of the variance in anxiety is captured by the neuroticism factor. Loadings greater than .71 are needed for a Big Five factor to explain more than 50% of the variance in a facet. There are only two facets where the majority of the variance in a facet is explained by a Big Five factor (order, self-discipline).
Secondary loadings can explain additional variance in some facets. For example, for anger/hostility neuroticism explains .48^2 = 23% of the variance and agreeableness explains another -.43^2 = 18% of the variance for a total of 23+18 = 41% explained variance. However, even with secondary loadings many facets have substantial residual variance. This is of course predicted by a hierarchical model of personality traits with more specific factors underneath the global Big Five traits. However, it also implies that Big Five measures fail to capture substantial personality variance. It is therefore not surprising that facet measures often predict additional variance in outcomes that it is not predicted by the Big Five (e.g., Schimmack, Oishi, Furr, & Funder, 2004). Personality researchers need to use facet level or other more specific measures of personality in addition to Big Five measures to capture all of the personality variance in outcomes.
What are the Big Five?
Factor loadings are often used to explore the constructs underlying factors. The terms neuroticism, extraversion, or openness are mere labels for the shared variance among facets with primary loadings on a factor. There has been some discussion about the Big Five factors and there meaning is still far from clear. For example, there has been a debate about the extraversion factor. Lucas, Diener, Grob, Suh, and Shao (2000) argued that extraversion is the disposition to respond strongly to rewards. Ashton, Lee, and Paunonen disagreed and argued that social attention underlies extraversion. Empirically it would be easy to answer these questions if one facet would show a very high loading on a Big Five factor. The more loadings approach one, the more a factor corresponds to a facet or is highly related to a facet. However, the loading pattern does not suggest that a single facet captures the meaning of a Big Five factor. The strongest relationship is found for self-discipline and conscientiousness. Thus, good self-regulation may be the core aspect of conscientiousness that also influences achievement striving or orderliness. However, more generally the results suggest that the nature of the Big Five factors is not obvious. It requires more work to uncover the glue that ties facets belonging to a single factor together. Theories range from linguistic structures to shared neurotransmitters.
Evaluative Bias
The results for evaluative bias are novel because previous studies failed to model evaluative bias in responses to the NEO-PI-R. It would be interesting to validate the variation in loadings on the evaluative bias factor with ratings of item- or facet-desirability. However, intuitively the variation makes sense. It is more desirable to be competent (C1, r = .66) and not depressed (N3, r = -69) than to be an excitement seeker (E5: r = .03) or compliant (A4: r = .09). The negative loading for modesty also makes sense and validates self-ratings of modesty (A5,r = -.33). Modest individuals are not supposed to exaggerate their desirable attributes and apparently they refrain from doing so also when they complete the NEO-PI-R.
Recently, McCrae (2018) acknowledged the presence of evaluative biases in NEO scores, but presented calculations that suggested the influence is relatively small. He suggested that facet-facet correlations might be inflated by .10 due to evaluative bias. However, this average is uninformative. It could imply that all facets have a loading of .33 or -.33 on the evaluative bias factor, which introduces a bias of .33*.33 = .10 or .33*-.33 = -.10 in facet-facet correlations. In fact, the average absolute loading on the evaluative bias factor is .30. However, this masks the fact that some facets have no evaluative bias and others have much more evaluative bias. For example, the measure of competence beliefs (self-effacy) C1 has a loading of .66 on the evaluative bias factor, which is higher than the loading on conscientiousness (.52). It should be noted that the NEO-PI-R is a commercial instrument and that it is in the interest of McCrae to claim that the NEO-PI-R is a valid measure for personalty assessment. In contrast, I have no commercial interest in finding more or less evaluative bias in the NEO-PI-R. This may explain the different conclusions about the practical significance of evaluative bias in NEO-PI-R scores.
In short, the present analysis suggests that the amount of evaluative bias varies across facet scales. While the influence of evaluative bias tends to be modest for many scales, scales with highly desirable traits show rather strong influence of evaluative bias. In the future it would be interesting to use multi-method data to separate evaluative bias from content variance (Anusic et al., 2009).
Measurement of the Big Five
Structural equation modeling can be used to test substantive theories with a measurement model or to develop and evaluate measurement models. Unfortunately, personality psychologists have not taken advantage of structural equation modeling to improve personality questionnaires. The present study highlights two ways in which SEM analysis of personality ratings is beneficial. First, it is possible to model evaluative bias and to search for items with low evaluative bias. Minimizing the influence of evaluative bias increases the validity of personality scales. Second, the present results can be used to create better measures of the Big Five. Many short Big Five scales focus exclusively on a single facet. As a result, these measures do not actually capture the Big Five. To measure the Big Five efficiently, a measure requires several facets with high loadings on the Big Five factor. Three facets are sufficient to create a latent variable model that separates the facet-specific residual variance from the shared variance that reflects the Big Five. Based on the present results, the following facets seem good candidates for the measurement of the Big Five.
Neuroticism: Anxiety, Anger, and Depression. The shared variance reflects a general tendency to respond with negative emotions.
Extraversion: Warmth, Gregariousness, Positive Emotions: The shared variance reflects a mix of sciability and cheerfulness.
Openness: Aesthetics, Action, Ideas. The shared variance reflects an interest in a broad range of activities that includes arts, intellectual stimulation, as well as travel.
Agreeableness: Straightforwardness, Altruism, Complicance: The shared variance represents respecting others.
Conscientiousness: Order, Self-Discipline, Dutifulness. I do not include achievement striving because it may be less consistent across the life span. The shared variance represents following a fixed set of rules.
This is of course just a suggestion. More research is needed. What is novel is the use of reflective measurement models to examine this question. McCrae et al. (1996) and some others before them tried and failed. Here I show that it is possible and useful to fit facet corelations with a structural equation model. Thus, twenty years after McCrae et al. suggested we should not use SEM/CFA, it is time to reconsider this claim and to reject it. Most personality theories are reflective models. It is time to test these models with the proper statistical method.
Most published psychological measures are unvalid. (subtitle) *unvalid = the validity of the measure is un-known.
This blog post served as a first draft for a manuscript that is currently under review at Meta-Psychology. You can find the latest version here (pdf).
Introduction
8 years ago, psychologists started to realize that they have a replication crisis. Many published results do not replicate in honest replication attempts that allow the data to decide whether a hypothesis is true or false.
The replication crisis is sometimes attributed to the lack of replication studies before 2011. However, this is not the case. Most published results were replicated successfully. However, these successes were entirely predictable from the fact that only successful replications would be published (Sterling, 1959). These sham replication studies provided illusory evidence for theories that have been discredited over the past eight years by credible replication studies.
New initiatives that are called open science are likely to improve the replicability of psychological science in the future, although progress towards this goal is painfully slow.
This blog post addresses another problem in psychological science. I call it the validation crisis. Replicability is only one necessary feature of a healthy science. Another necessary feature of a healthy science is the use of valid measures. This feature of a healthy science is as obvious as the need for replicability. To test theories that relate theoretical constructs to each other (e.g., construct A influences construct B for individuals drawn from population P under conditions C), it is necessary to have valid measures of constructs. However, it is unclear which criteria a measure has to fulfill to have construct validity. Thus, even successful and replicable tests of a theory may be false because the measures that were used lacked construct validity.
Construct Validity
The classic article on “Construct Validity” was written by two giants in psychology; Cronbach and Meehl (1955). Every graduate student of psychology and surely every psychologists who published a psychological measure should be familiar with this article.
The article was the result of an APA task force that tried to establish criteria, now called psychometric properties, for tests to be published. The result of this project was the creation of the construct “Construct validity”
The chief innovation in the Committee’s report was the term construct validity. (p. 281).
Cronbach and Meehl provide their own definition of this construct.
Construct validation is involved whenever a test is to be interpreted as a measure of some attribute or quality which is not “operationally defined” (p. 282).
In modern language, construct validity is the relationship between variation in observed test scores and a latent variable that reflects corresponding variation in a theoretical construct (Schimmack, 2010).
Thinking about construct validity in this way makes it immediately obvious why it is much easier to demonstrate predictive validity, which is the relationship between observed tests scores and observed criterion scores than to establish construct validity, which is the relationship between observed test scores and a latent, unobserved variable. To demonstrate predictive validity, one can simply obtain scores on a measure and a criterion and compute the correlation between the two variables. The correlation coefficient shows the amount of predictive validity of the measure. However, because constructs are not observable, it is impossible to use simple correlations to examine construct validity.
The problem of construct validation can be illustrated with the development of IQ scores. IQ scores can have predictive validity (e.g., performance in graduate school) without making any claims about the construct that is being measured (IQ tests measure whatever they measure and what they measure predicts important outcomes). However, IQ tests are often treated as measures of intelligence. For IQ tests to be valid measures of intelligence, it is necessary to define the construct of intelligence and to demonstrate that observed IQ scores are related to unobserved variation in intelligence. Thus, construct validation requires clear definitions of constructs that are independent of the measure that is being validated. Without clear definition of constructs, the meaning of a measure reverts essentially to “whatever the measure is measuring,” as in the old saying “Intelligence is whatever IQ tests are measuring. This saying shows the problem of research with measures that have no clear construct and no construct validity.
In conclusion, the challenge in construct validation research is to relate a specific measure to a well-defined construct and to establish that variation in test scores are related to variation in the construct.
What are Constructs
Construct validation starts with an assumption. Individuals are assumed to have an attribute, today we may say personality trait. Personality traits are typically not directly observable (e.g., kindness rather than height), but systematic observation suggests that the attribute exists (some people are kinder than others across time and situations). The first step is to develop a measure of this attribute (e.g., a self-report measure “How kind are you?”). If the test is valid, variation in the observed scores on the measure should be related to the personality trait.
A construct is some postulated attribute of people, assumed to be reflected in test performance (p. 283).
The term “reflected” is consistent with a latent variable model, where unobserved traits are reflected in observable indicators. In fact, Cronbach and Meehl argue that factor analysis (not principle component analysis!) provides very important information for construct validity.
We depart from Anastasi at two points. She writes, “The validity of a psychological test should not be confused with an analysis of the factors which determine the behavior under consideration.” We, however, regard such analysis as a most important type of validation. (p. 286).
Factor analysis is useful because factors are unobserved variables and factor loadings show how strongly an observed measure is related to variation in a an unobserved variable; the factor. If multiple measures of a construct are available, they should be positively correlated with each other and factor analysis will extract a common factor. For example, if multiple independent raters agree in their ratings of individuals’ kindness, the common factor in these ratings may correspond to the personality trait kindness, and the factor loadings provide evidence about the degree of construct validity of each measure (Schimmack, 2010).
In conclusion, factor analysis provides useful information about construct validity of measures because factors represent the construct and factor loadings show how strongly an observed measure is related to the construct.
It is clear that factors here function as constructs (p. 287).
Convergent Validity
The term convergent validity was introduced a few years later in another seminal article on validation research by Campbell and Fiske (1959). However, the basic idea of convergent validity was specified by Cronbach and Meehl (1955) in the section “Correlation matrices and factor analysis”
If two tests are presumed to measure the same construct, a correlation between them is predicted (p. 287).
If a trait such as dominance is hypothesized, and the items inquire about behaviors subsumed under this label, then the hypothesis appears to require that these items be generally intercorrelated (p. 288)
Cronbach and Meehl realize the problem of using just two observed measures to examine convergent validity. For example, self-informant correlations are often used in personality psychology to demonstrate validity of self-ratings. However, a correlation of r = .4 between self-ratings and informant ratings is open to very different interpretations. The correlation could reflect very high validity of self-ratings and modest validity of informant ratings or the opposite could be true.
If the obtained correlation departs from the expectation, however, there is no way to know whether the fault lies in test A, test B, or the formulation of the construct. A matrix of intercorrelations often points out profitable ways of dividing the construct into more meaningful parts, factor analysis being a useful computational method in such studies. (p. 300)
A multi-method approach avoids this problem and factor loadings on a common factor can be interpreted as validity coefficients. More valid measures should have higher loadings than less valid measures. Factor analysis requires a minimum of three observed variables, but more is better. Thus, construct validation requires a multi-method assessment.
Discriminant Validity
The term discriminant validity was also introduced later by Campbell and Fiske (1959). However, Cronbach and Meehl already point out that high or low correlations can support construct validity. Crucial for construct validity is that the correlations are consistent with theoretical expectations.
For example, low correlations between intelligence and happiness do not undermine the validity of an intelligence measure because there is no theoretical expectation that intelligence is related to happiness. In contrast, low correlations between intelligence and job performance would be a problem if the jobs require problem solving skills and intelligence is an ability to solve problems faster or better.
Only if the underlying theory of the trait being measured calls for high item intercorrelations do the correlations support construct validity (p. 288).
Quantifying Construct Validity
It is rare to see quantitative claims about construct validity. Most articles that claim construct validity of a measure simply state that the measure has demonstrated construct validity as if a test is either valid or invalid. However, the previous discussion already made it clear that construct validity is a quantitative construct because construct validity is the relation between variation in a measure and variation in the construct and this relation can vary . If we use standardized coefficients like factor loadings to assess the construct validity of a measure, construct validity can range from -1 to 1.
Contrary to the current practices, Cronbach and Meehl assumed that most users of measures would be interested in a “construct validity coefficient.”
There is an understandable tendency to seek a “construct validity coefficient. A numerical statement of the degree of construct validity would be a statement of the proportion of the test score variance that is attributable to the construct variable. This numerical estimate can sometimes be arrived at by a factor analysis” (p. 289).
Cronbach and Meehl are well-aware that it is difficult to quantify validity precisely, even if multiple measures of a construct are available because the factor may not be perfectly corresponding with the construct.
Rarely will it be possible to estimate definite “construct saturations,” because no factor corresponding closely to the construct will be available (p. 289).
And nobody today seems to remember Cronbach and Meehl’s (1955) warning that rejection of the null-hypothesis, the test has zero validity, is not the end goal of validation research.
It should be particularly noted that rejecting the null hypothesis does not finish the job of construct validation (p. 290)
The problem is not to conclude that the test “is valid” for measuring- the construct variable. The task is to state as definitely as possible the degree of validity the test is presumed to have (p. 290).
One reason why psychologists may not follow this sensible advice is that estimates of construct validity for many tests are likely to be low (Schimmack, 2010).
The Nomological Net – A Structural Equation Model
Some readers may be familiar with the term “nomological net” that was popularized by Cronbach and Meehl. In modern language a nomological net is essentially a structural equation model.
The laws in a nomological network may relate (a) observable properties or quantities to each other; or (b) theoretical constructs to observables; or (c) different theoretical constructs to one another. These “laws” may be statistical or deterministic.
It is probably no accident that at the same time as Cronbach and Mehl started to think about constructs as separate from observed measures, structural equation model was developed as a combination of factor analysis that made it possible to relate observed variables to variation in unobserved constructs and path analysis that made it possible to relate variation in constructs to each other. Although laws in a nomological network can take on more complex forms than linear relationships, a structural equation model is a nomological network (but a nomological network is not necessarily a structural equation model).
As proper construct validation requires a multi-method approach and demonstration of convergent and discriminant validity, SEM is ideally suited to examine whether the observed correlations among measures in a mulit-trait-multi-method matrix are consistent with theoretical expectations. In this regard, SEM is superior to factor analysis. For example, it is possible to model shared method variance, which is impossible with factor analysis.
Cronbach and Meehl also realize that constructs can change as more information becomes available. It may also occur that the data fail to provide evidence for a construct. In this sense, construct validiation is an ongoing process of improved understanding of unobserved constructs and how they are related to observable measures.
Ideally this iterative process would start with a simple structural equation model that is fitted to some data. If the model does not fit, the model can be modified and tested with new data. Over time, the model would become more complex and more stable because core measures of constructs would establish the construct validity, while peripheral relationships may be modified if new data suggest that theoretical assumptions need to be changed.
When observations will not fit into the network as it stands, the scientist has a certain freedom in selecting where to modify the network (p. 290).
Too often psychologists use SEM only to confirm an assumed nomological network and it is often considered inappropriate to change a nomological network to fit observed data. However, SEM is as much testing of an existing construct as exploration of a new construct.
The example from the natural sciences was the initial definition of gold as having a golden color. However, later it was discovered that the pure metal gold is actually silver or white and that the typical yellow color comes from copper impurities. In the same way, scientific constructs of intelligence can change depending on the data that are observed. For example, the original theory may assume that intelligence is a unidimensional construct (g), but empirical data could show that intelligence is multi-faceted with specific intelligences for specific domains.
However, given the lack of construct validation research in psychology, psychology has seen little progress in the understanding of such basic constructs such as extraversion, self-esteem, or wellbeing. Often these constructs are still assessed with measures that were originally proposed as measures of these constructs, as if divine intervention led to the creation of the best measure of these constructs and future research only confirmed their superiority.
Instead many claims about construct validity are based on conjectures than empirical support by means of nomological networks. This was true in 1955. Unfortunately, it is still true over 50 years later.
For most tests intended to measure constructs, adequate criteria do not exist. This being the case, many such tests have been left unvalidated, or a finespun network of rationalizations has been offered as if it were validation. Rationalization is not construct validation. One who claims that his test reflects a construct cannot maintain his claim in the face of recurrent negative results because these results show that his construct is too loosely defined to yield verifiable inferences (p. 291).
Given the difficulty of defining constructs and finding measures for it, even measures that show promise in the beginning might fail to demonstrate construct validity later and new measures should show higher construct validity than the early measures. However, psychology shows no development in measures of the same construct. The most widely used measure of self-esteem is still Rosenberg’s scale from 1965 and the most widely used measure of wellbieng is still Diener et al.’s scale from 1984. It is not clear how psychology can make progress, if it doesn’t make progress in the development of nomological networks that provide information about constructs and about the construct validity of measures.
Cronbach and Meehl are clear that nomological networks are needed to claim construct validity.
To validate a claim that a test measures a construct, a nomological net surrounding the concept must exist (p. 291).
However, there are few attempts to examine construct validity with structural equation models (Connelly & Ones, 2010; Zou, Schimmack, & Gere, 2013). [please share more if you know some]
One possible reason is that construct validation research may reveal that authors initial constructs need to be modified or their measures have modest validity. For example, McCrae, Zonderman, Costa, Bond, and Paunonen (1996) dismissed structural equation modeling as a useful method to examine the construct validity of Big Five measures because it failed to support their conception of the Big Five as orthogonal dimensions with simple structure.
Recommendations for Users of Psychological Measures
The consumer can accept a test as a measure of a construct only when there is a strong positive fit between predictions and subsequent data. When the evidence from a proper investigation of a published test is essentially negative, it should be reported as a stop sign to discourage use of the test pending a reconciliation of test and construct, or final abandonment of the test (p. 296).
It is very unlikely that all hunches by psychologists lead to the discovery of useful constructs and development of valid tests of these constructs. Given the lack of knowledge about the mind, it is rather more likely that many constructs turn out to be non-existent and that measures have low construct validity.
However, the history of psychological measurement has only seen development of more and more constructs and more and more measures to measure this increasing universe of constructs. Since the 1990s, constructs have doubled because every construct has been split into an explicit and an implicit version of the construct. Presumably, there is even implicit political orientation or gender identity.
The proliferation of constructs and measures is not a sign of a healthy science. Rather it shows the inability of empirical studies to demonstrate that a measure is not valid or that a construct may not exist. This is mostly due to self-serving biases and motivated reasoning of test developers. The gains from a measure that is widely used are immense. Thus, weak evidence is used to claim that a measure is valid and consumers are complicit because they can use these measures to make new discoveries. Even when evidence shows that a measure may not work as intended (e.g., Bosson et al., 2000), it is often ignored (Greenwald & Farnham, 2001).
Conclusion
Just like psychologist have started to appreciate replication failures in the past years, they need to embrace validation failures. Some of the measures that are currently used in psychology are likely to have insufficient construct validity. If this was the decade of replication, the 2020s may become the decade of validation, and maybe the 2030s may produce the first replicable studies with valid measures. Maybe this is overly optimistic, given the lack of improvement in validation research since Cronbach and Meehl (1955) outlined a program of construct validation research. Ample citations show that they were successful in introducing the term, but they failed in establishing rigorous criteria of construct validity. The time to change this is now.
Article:
William A. Cunningham, Kristopher J. Preacher, and Mahzarin R. Banaji. (2001).
Implicit Attitude Measures: Consistency, Stability, and Convergent Validity, Psychological Science, 12(2), 163-170.
Abstract:
In recent years, several techniques have been developed to measure implicit social cognition. Despite their increased use, little attention has been devoted to their reliability and validity. This article undertakes a direct assessment of the interitem consistency, stability, and convergent validity of some implicit attitude measures. Attitudes toward blacks and whites were measured on four separate occasions, each 2 weeks apart, using three relatively implicit measures (response window evaluative priming, the Implicit Association Test, and the response-window Implicit Association Test) and one explicit measure (Modern Racism Scale). After correcting for interitem inconsistency with latent variable analyses, we found that (a) stability indices improved and (b) implicit measures were substantially correlated with each other, forming a single latent factor. The psychometric properties of response-latency implicit measures have greater integrity than recently suggested.
Critique of Original Article
This article has been cited 362 times (Web of Science, January 2017). It still is one of the most rigorous evaluations of the psychometric properties of the race Implicit Association Test (IAT). As noted in the abstract, the strength of the study is the use of several implicit measures and the repeated measurement of attitudes on four separate occasions. This design makes it possible to separate several variance components in the race IAT. First, it is possible to examine how much variance is explained by causal factors that are stable over time and shared by implicit and explicit attitude measures. Second, it is possible to measure the amount of variance that is unique to the IAT. As this component is not shared with other implicit measures, this variance can be attributed to systematic measurement error that is stable over time. A third variance component is variance that is shared only with other implicit measures and that is stable over time. This variance component could reflect stable implicit racial attitudes. Finally, it is possible to identify occasion specific variance in attitudes. This component would reveal systematic changes in implicit attitudes.
The original article presents a structural equation model that makes it possible to identify some of these variance components. However, the model is not ideal for this purpose and the authors do not test some of these variance components. For example, the model does not include any occasion specific variation in attitudes. This could be because attitudes do not vary over the one-month interval of the study, or it could mean that the model failed to specify this variance component.
This reanalysis also challenges the claim by the original authors that they provided evidence for a dissociation of implicit and explicit attitudes. “We found a dissociation between implicit and explicit measures of race attitude: Participants simultaneously self-reported nonprejudiced explicit attitudes toward black Americans while showing an implicit difficulty in associating black with positive attributes” (p. 169). The main problem is that the design does not allow to make this claim because the study included only a single explicit racism measure. Consequently, it is impossible to determine whether unique variance in the explicit measure reflects systematic measurement in explicit attitude measures (social desirable responding, acquiescence response styles) or whether this variance reflects consciously accessible attitudes that are distinct from implicit attitudes. In this regard, the authors claim that “a single-factor solution does not fit the data” (p. 170) is inconsistent with their own structural equation model that shows a single second-order factor that explains the covariance among the three implicit measures and the explicit measure.
The authors caution that a single IAT measure is not very reliable, but their statement about reliability is vague. “Our analyses of implicit attitude measures suggest that the degree of measurement error in response-latency measures can be substantial; estimates of Cronbach’s alpha indicated that, on average, more than 30% of the variance associated with the measurements was random error.” (p. 160). More than 30% random measurement error leaves a rather large range of reliability estimates ranging from 0% to 70%. The respective parameter estimates for the IAT in Figure 4 are .53^2 = .28, .65^2 = .42, .74^2 = .55, and .38^2 = .14. These reliability estimates vary considerably due to the small sample size, but the loading of the first IAT would suggest that only 19% of the variance in a single IAT is reliable. As reliablity is the upper limit for validity, it would imply that no more than 20% of the variance in a single IAT captures variation in implicit racial attitudes.
The authors caution readers about the use of a single IAT to measure implicit attitudes. “When using latency-based measures as indices of individual differences, it may be essential to employ analytic techniques, such as covariance structure modeling, that can separate measurement error from a measure of individual differences. Without such analyses, estimates of relationships involving implicit measures may produce misleading null results” (p. 169). However, the authors fail to mention that the low reliability of a single IAT also has important implications for the use of the IAT for the assessment of implicit prejudice. Given this low estimate of validity, users of the Harvard website that provides information about individual’s performance on the IAT should be warned that the feedback is neither reliable nor valid by conventional standards for psychological tests.
Reanalysis of Published Correlation Matrix
The Table below reproduces the correlation matrix. The standard deviations in the last row are rescaled to avoid rounding problems. This has no effect on the results.
1-4 = Modern Racism Scale (1-4); 5-8 Implicit Association Test (1-4); 9-12 = Response Window IAT (1-4); 13-16 Response Window Evaluative Priming (1-4)
Fitting the data to the original model reproduced the original results. I then fitted the data to a model with a single attitude factor (see Figure 1). The model also allowed for measure-specific variances. An initial model showed no significant measure-specific variances for the two versions of the IAT . Hence, these method factors were not included in the final model. To control for variance that is clearly consciously accessible, I modeled the relationship between the explicit factor and the attitude factor as a causal path from the explicit factor to the attitude factor. This path should not be interpreted as a causal relationship in this case. Rather the path can be used to estimate how much of the variance in the attitude factor is explained by consciously accessible information that influences the explicit measure. In this model, the residual variance is variation that is shared among implicit measures, but not with the explicit measure.
The model had good fit to the data. I then imposed constraints on factor loadings. The constrained model had better fit than the unconstrained model (delta AIC = 4.60, delta BIC = 43.53). The main finding is that the standard IAT had a loading of .55 on the attitude factor. The indirect path from the implicit attitude factor to a single IAT measure is only slightly smaller, .55*.92 = .51. The 95%CI for this parameter ranged from .41 to .60. The upper bound of the 95%CI would imply that at most 36% of the variance in a single IAT reflects implicit racial attitudes. However, it is important to note that the model in Figure 1 assumes that the Modern Racism Scale is a perfectly valid measure of consciously accessible attitudes. Any systematic measurement error in the Modern Racism Scale would reduce the amount of variance in the attitude factor that reflects unconscious factors. Again, the lack of multiple explicit measures makes it impossible to separate systematic measurement error from valid variance in explicit measures. Thus, the amount of variance in a single IAT that reflects unconscious racial attitudes can range from 0 to 36%.
How Variable are Implicit Racial Attitudes?
The design repeated measurement of implicit attitudes on four occasions. If recent experiences influence implicit attitudes, we would expect that implicit measures of attitudes on the same occasion are more highly correlated with each other than implicit measures taken on different occasions. Given the low validity of implicit attitude measures, I examined this question with constrained parameters. By estimating a single parameter, the model has more power to reveal a consistent relationship between implicit measures that were obtained during the same testing session. Neither the two IATs, nor the IAT and the evaluative priming task (EP) showed significant occasion-specific variance. Although this finding may be due to low power to detect occasion specific variation, this finding suggests that most of the variance in an IAT is due to stable variation and random measurement error.
Conclusion
Cunningham et al. (2001) conducted a rigorous psychometric study of the Implicit Association Test. The original article reported results that could be reproduced. The authors correctly interpret their results as evidence that a single IAT has low reliability. However, they falsely imply that their results provide evidence that the IAT and other implicit measures are valid measures of an implicit form of racism that is not consciously accessible. My new analysis shows that their results are consistent with this hypothesis, if one assumes that the Modern Racism Scale is a perfectly valid measure of consciously accessible racial attitudes. Under this assumption, about 25% (95%CI 16-36) of the variance in a single IAT would reflect implicit attitudes. However, it is rather unlikely that the Modern Racism Scale is a perfect measure of explicit racial attitudes, and the amount of variance in performance on the IAT that reflects unconscious racism is likely to be smaller. Another important finding that was implicit, but not explicitly mentioned, in the original model is that there is no evidence for situation-specific variation in implicit attitudes. At least over the one-month period of the study, racial attitudes remained stable and did not vary as a function of naturally occurring events that might influence racial attitudes (e.g., positive or negative intergroup contact). This finding may explain why experimental manipulations of implicit attitudes also often produce very small effects (Joy Gaba & Nosek, 2010).
One surprising finding was that the IAT showed no systematic measurement error in this model. This would imply that repeated measures of the IAT could be used to measure racial attitudes with high validity. Unfortunately, most studies with the IAT rely on a single testing situation and ignore that most of the variance in a single IAT is measurement error. To improve research on racial attitudes and prejudice, social psychologists should use multiple explicit and implicit measures and use structural equation models to examine which variance components of a measurement model of racial attitudes predict actual behavior.
This blog post reports the results of an analysis of correlations among 4 explicit and 3 implicit attitude measures published by Ranganath, Tucker, and Nosek (2008).
Original article:
Kate A. Ranganath, Colin Tucker Smith, & Brian A. Nosek (2008). Distinguishing automatic and controlled components of attitudes from direct and indirect measurement methods. Journal of Experimental Social Psychology 44 (2008) 386–396; doi:10.1016/j.jesp.2006.12.008
Abstract
Distinct automatic and controlled processes are presumed to influence social evaluation. Most empirical approaches examine automatic processes using indirect methods, and controlled processes using direct methods. We distinguished processes from measurement methods to test whether a process distinction is more useful than a measurement distinction for taxonomies of attitudes. Results from two studies suggest that automatic components of attitudes can be measured directly. Direct measures of automatic attitudes were reports of gut reactions (Study 1) and behavioral performance in a speeded self-report task (Study 2). Confirmatory factor analyses comparing two factor models revealed better fits when self-reports of gut reactions and speeded self-reports shared a factor with automatic measures versus sharing a factor with controlled self-report measures. Thus, distinguishing attitudes by the processes they are presumed to measure (automatic versus controlled) is more meaningful than distinguishing based on the directness of measurement.
Description of Original Study
Study 1 measured relative attitudes towards heterosexuals and homosexuals with seven measures; four explicit measures and three reaction time tasks. Specifically, the four explicit measures were
Actual = Participants were asked to report their “actual feelings” towards gay and straight people when given enough time for full consideration on a scale ranging from 1=very negative to 8 = very positive.
Gut = Participants were asked to report their “gut reaction” towards gay and straight people when given enough time for full consideration on a scale ranging from 1=very negative to 8 = very positive.
Time0 and Time5: A second explicit rating task assessed an “attitude timeline”. Participants reported their attitudes toward the two groups at multiple time points: (1) instant reaction, (2) reaction a split-second later, (3) reaction after 1 s, (4) reaction after 5 s, and (5) reaction when given enough time to think fully. Only the first (Time0) and the last (Time5) rating were included in the model.
The three reaction time measures were the Implicit Association Test (IAT), the Go-NoGo Association Test (GNAT), and a Four-Category Sorting Paired Features Task (SPF). All three measures use differences in response times to measure attitudes.
Table A1 in the Appendix reported the correlations among the seven tasks.
The authors tested a variety of structural equation models. The best fitting model, preferred by the authors, was a model with three correlated latent factors. “In this three-factor model, self-reported gut feelings (GutFeeling, Instant Feeling) comprised their own attitude factor distinct from a factor comprised of the indirect, automatic measures (IAT, GNAT, SPF) and from a factor comprised of the direct, controlled measures (Actual Feeling, Fully Considered Feeling). The data were an excellent fit (chi^2(12) = 10.8).
The authors then state “while self-reported gut feelings were more similar to the indirect measures than to the other self-reported attitude measures, there was some unique variance in self-reported gut feelings that was distinct from both.” (p. 391) and they go on to speculate that “one possibility is that these reports are a self-theory that has some but not complete correspondence with automatic evaluations” (p. 391). The also consider the possibility that “measures like the IAT, GNAT, and SPF partly assess automatic evaluations that are “experienced” and amenable to introspective report, and partly evaluations that are not” (p. 391). But they favor the hypothesis that “self-report of ‘gut feelings’ is a meaningful account of some components of automatic evaluation” (p. 391). The interpret these results as strong support for their “contention that a taxonomy of attitudes by measurement features is not as effective as one that distinguishes by presumed component processes” (p. 391). The conclusion reiterates this point. “The present studies suggest that attitudes have distinct but related automatic and controlled factors contributing to social evaluation and that parsing attitudes by underlying processes is superior to parsing attitude measures by measurement features” (p. 393). Surprisingly, the author do not mention the three-factor model in the Discussion and rather claim support for a two-factor model that distinguishes processes rather than measures (explicit vs. implicit). “In both studies, model comparison using confimatory factor analysis showed the data were better fit to a two-factor model distinguishing automatic and controlled components of attitudes than to a model distinguishing attitudes by whether they were measured directly or indirectly” (p. 393). The authors then suggest that some explicit measures (ratings of gut reactions) can measure automatic attitudes. “These findings suggest that direct measures can be devised to capture automatic components of attitudes despite suggestions that indirect measures are essential for such assessments” (p. 393).
New Analysis
The main problem with this article is that the author never report parameter estimates for the model. Depending on the pattern of correlations among the three factors and factor loadings, the interpretation of the results can change. I first tried to fit the three-factor model to the covariance matrix (setting variances to 1) to the published correlation matrix. MPLUS7.1 showed some problems with negative residual variance for Actual. Also the model had one less degree of freedom than the published model. However, fixing the residual variance of actual did not solve the problem. I then proceeded to fit my own model. The model is essentially the same model as the three-factor model with the exception that I modeled the correlation among the three-latent factor with a single higher-order factor. This factor represents variation in common causes that influences all attitude measures. The problem of negative variance in the actual measure was solved by allowing for an extra correlation between the actual and gut ratings. As seen in the correlation table, these two explicit measures correlated more highly with each other (r = .65) than the corresponding T0 and T5 measures (rs = .54, .50). As in the original article, model fit was good (see Figure). Figure 1 shows for the first time the parameter estimates of the model.
The loadings of the explicit measures on the primary latent factors are above .80. For single item measures, this implies that these ratings are essentially measuring the same construct with some random error. Thus, the latent factors can be interpreted as explicit ratings of affective responses immediately or after some reflection. The loadings of these two factors on the higher order factor show that reflective and immediate responses are strongly influenced by the common factor. This is not surprising. Reflection may alter the immediate response somewhat, but it is unlikely to reverse or dramatically change the response a few seconds later. Interestingly, the immediate response has a higher loading on the attitude factor, although in this small sample the differences in loadings is not significant (chi^2(1) = 0.22. The third primary factor represents the shared variance among the three reaction time measures. It also loads on the general attitude factor, but the loading is weaker than the loading for the explicit measures. The parameter estimates suggest that about 25% of the variance is explained by the common attitude (.51^2) and 75% is unique to the reaction time measures. This variance component can be interpreted as unique variance in implicit measures. The factor loadings of the three reaction time measures are also relevant. The loading of the IAT suggests that only 28% (.53^2) of the observed variance in the IAT reflects the effect of causal factors that influence reaction time measures of attitudes. As some of this variance is also shared with explicit measures, only 21% ((.86*.53)^2) of the variance in the IAT represents the variance in the implicit attitude factor This has important implications for the use of the IAT to examine potential effects of implicit attitudes on behavior. Even if implicit attitudes had a strong effect on a behavior (r = .5), the correlation between IAT scores and the behavior only would be r = .86*.53*.5 = .23. A sample size of N = 146 participants would be needed to have 80% power to provide significant evidence for such a relationship (p < .05, two-tailed). Given a more modest effect of attitudes on behavior, r = .86*.53*.30 = .14, the sample size would need to be larger (N = 398). As many studies of implicit attitudes and behavior used smaller samples, we would expect many non-significant results, unless non-significant results remain unreported and published results report inflated effect sizes. One solution to the problem of low power in studies of implicit attitudes would be the use of multiple implicit attitude measures. This study suggests that a battery of different reaction time tasks can be used to remove random and task specific measurement error. Such a multi-method approach to the measurement of implicit attitudes is highly recommended for future studies because it would also help to interpret results of studies in which implicit attitudes do not influence behavior. If a set of implicit measures show convergent validity, this finding would indicate that implicit attitudes did not influence the behavior. In contrast, a null-result with a single implicit measure may simply show that the measure failed to measure implicit attitudes.
Conclusion
This article reported some interesting data, but failed to report the actual results. This analysis of the data showed that explicit measures are highly correlated with each other and show discriminant validity from implicit, reaction time measures. The new analysis also made it possible to estimate the amount of variance in the Implicit Association Test that reflects variance that is not shared with explicit measures but shared with other implicit measures. The estimate of 20% suggests that most of the variance in the IAT is due to factors other than implicit attitudes and that the test cannot be used to diagnose individuals. Whether the 20% of variance that is uniquely shared with other implicit measures reflects unconscious attitudes or method variance that is common to reaction time tasks remains unclear. The model also implies that predictive validity of a single IAT for prejudice behaviors is expected to be small to moderate (r < .30), which means large samples are needed to study the effect of implicit attitudes on behavior.