

Galileo had the clever idea to turn a microscope into a telescope and to point it towards the night sky. His first discovery was that Jupiter had four massive moons that are now known as the Galilean moons (Space.com).
Now imagine what would have happened if Galileo had an a priori theory that Jupiter has five moons and after looking through the telescope, Galileo decided that the telescope was faulty because he could see only four moons. Surely, there must be five moons and if the telescope doesn’t show them, it is a problem of the telescope. Astronomers made progress because they created credible methods and let empirical data drive their theories. Eventually even better telescopes discovered many more, smaller moons orbiting around Jupiter. This is scientific progress.
Alas, psychologists don’t follow the footsteps of natural sciences. They mainly use the scientific method to provide evidence that confirms their theories and dismiss or hide evidence that disconfirms their theories. They also show little appreciation for methodological improvements and often use methods that are outdated. As a result, psychology has made little progress in developing theories that rest of solid empirical foundations.
An example of this ill-fated approach to science is McCrae et al.’s (1996) attempt to confirm their five factor model with structural equation modeling (SEM). When they failed to find a fitting model, they decided that SEM is not an appropriate method to study personality traits because SEM didn’t confirm their theory. One might think that other personality psychologists realized this mistake. However, other personality psychologists were also motivated to find evidence for the Big Five. Personality psychologists had just recovered from an attack by social psychologists that personality traits does not even exist, and they were all too happy to rally around the Big Five as a unifying foundation for personality research. Early warnings were ignored (Block, 1995). As a result, the Big Five have become the dominant model of personality without subjecting the theory to rigorous tests and even dismissing evidence that theoretical models do not fit the data (McCrae et al., 1996). It is time to correct this and to subject Big Five theory to a proper empirical test by means of a method that can falsify bad models.
I have demonstrated that it is possible to recover five personality factors, and two method factors, from Big Five questionnaires (Schimmack, 2019a, 2019b, 2019c). These analyses were limited by the fact that the questionnaires were designed to measure the Big Five factors. A real test of Big Five theory requires to demonstrate that the Big Five factors explain the covariations among a large set of a personality traits. This is what McCrae et al. (1996) tried and failed to do. Here I replicate their attempt to fit a structural equation model to the 30 personality traits (facets) in Costa and McCrae’s NEO-PI-R.
In a previous analysis I was able to fit an SEM model to the 30 facet-scales of the NEO-PI-R (Schimmack, 2019d). The results only partially supported the Big Five model. However, these results are inconclusive because facet-scales are only imperfect indicators of the 30 personality traits that the facets are intended to measure. A more appropriate way to test Big Five theory is to fit a hierarchical model to the data. The first level of the hierarchy uses items as indicators of 30 facet factors. The second level in the hierarchy tries to explain the correlations among the 30 facets with the Big Five. Only structural equation modeling is able to test hierarchical measurement models. Thus, the present analyses provide the first rigorous test of the five-factor model that underlies the use of the NEO-PI-R for personality assessment.
The complete results and the MPLUS syntax can be found on OSF (https://osf.io/23k8v/). The NEO-PI-R data are from Lew Goldberg’s Eugene-Springfield community sample. Theyu are publicly available at the Harvard Dataverse.
Results
Items
The NEO-PI-R has 240 items. There are two reasons why I analyzed only a subset of items. First, 240 variables produce 28,680 covariances, which is too much for a latent variable model, especially with a modest sample size of 800 participants. Second, a reflective measurement model requires that all items measure the same construct. However, it is often not possible to fit a reflective measurement model to the eight items of a NEO-facet. Thus, I selected three core-items that captured the content of a facet and that were moderately positively correlated with each other after reversing reverse-scored items. Thus, the results are based on 3 * 30 = 90 items. It has to be noted that the item-selection process was data-driven and needs to be cross-validated in a different dataset. I also provide information about the psychometric properties of the excluded items in an Appendix.
The first model did not impose a structural model on the correlations among the thirty facets. In this model, all facets were allowed to correlate freely with each other. A model with only primary factor loadings had poor fit to the data. This is not surprising because it is virtually impossible to create pure items that reflect only one trait. Thus, I added secondary loadings to the model until acceptable model fit was achieved and modification indices suggested no further secondary loadings greater than .10. This model had acceptable fit, considering the use of single-items as indicators, CFI = .924, RMSEA = .025, .035. Further improvement of fit could only be achieved by adding secondary loadings below .10, which have no practical significance. Model fit of this baseline model was used to evaluate the fit of a model with the Big Five factors as second-order factors.
To build the actual model, I started with a model with five content factors and two method factors. Item loadings on the evaluative bias factor were constrained to 1. Item loadings for on the acquiescence factor were constrained to 1 or -1 depending on the scoring of the item. This model had poor fit. I then added secondary loadings. Finally, I allowed for some correlations among residual variances of facet factors. Finally, I freed some loadings on the evaluative bias factor to allow for variation in desirability across items. This way, I was able to obtain a model with acceptable model fit, CFI = .926, RMSEA = .024, SRMR = .045. This model should not be interpreted as the best or final model of personality structure. Given the exploratory nature of the model, it merely serves as a baseline model for future studies of personality structure with SEM. That being said, it is also important to take effect sizes into account. Parameters with substantial loadings are likely to replicate well, especially in replication studies with similar populations.
Item Loadings
Table 1 shows the item-loadings for the six neuroticism facets. All primary loadings exceed .4, indicating that the three indicators of a facet measure a common construct. Loadings on the evaluative bias factors were surprisingly small and smaller than in other studies (Anusic et al., 2009; Schimmack, 2009a). It is not clear whether this is a property of the items or unique to this dataset. Consistent with other studies, the influence of acquiescence bias was weak (Rorer, 1965). Secondary loadings also tended to be small and showed no consistent pattern. These results show that the model identified the intended neuroticism facet-factors.


Table 2 shows the results for the six extraversion facets. All primary factor loadings exceed .40 and most are more substantial. Loadings on the evaluative bias factor tend to be below .20 for most items. Only a few items have secondary loadings greater than .2. Overall, this shows that the six extraversion facets are clearly identified in the measurement model.


Table 3 shows the results for Openness. Primary loadings are all above .4 and the six openness factors are clearly identified.


Table 4 shows the results for the agreeableness facets. In general, the results also show that the six factors represent the agreeableness facets. The exception is the Altruism facet, where only two items show a substantial loadings. Other items also had low loadings on this factor (see Appendix). This raises some concerns about the validity of this factor. However, the high-loading items suggest that the factor represents variation in selfishness versus selflessness.


Table 5 shows the results for the conscientiousness facets. With one exception, all items have primary loadings greater than .4. The problematic item is the item “produce and common sense” (#5) of the competence facet. However, none of the remaining five items were suitable (Appendix).


In conclusion, for most of the 30 facets it was possible to build a measurement model with three indicators. To achieve fit, the model included 76 out of 2,610 (3%) secondary loadings. Many of these secondary loadings were between .1 and .2, indicating that they have no substantial influence on the correlations of factors with each other.
Facet Loadings on Big Five Factors
Table 6 shows the loadings of the 30 facets on the Big Five factors. Broadly speaking the results provide support for the Big Five factors. 24 of the 30 facets (80%) have a loading greater than .4 on the predicted Big Five factor, and 22 of the 30 facets (73%) have the highest loading on the predicted Big Five factor. Many of the secondary loadings are small (< .3). Moreover, secondary loadings are not inconsistent with Big Five theory as facet factors can be related to more than one Big Five factor. For example, assertiveness has been related to extraversion and (low) agreeableness. However, some findings are inconsistent with McCrae et al.’s (1996) Five factor model. Some facets do not have the highest loading on the intended factor. Anger-hostility is more strongly related to low agreeableness than to neuroticism (-.50 vs. .42). Assertiveness is also more strongly related to low agreeableness than to extraversion (-.50 vs. .43). Activity is nearly equally related to extraversion and low agreeableness (-.43). Fantasy is more strongly related to low conscientiousness than to openness (-.58 vs. .40). Openness to feelings is more strongly related to neuroticism (.38) and extraversion (.54) than to openness (.23). Finally, trust is more strongly related to extraversion (.34) than to agreeableness (.28). Another problem is that some of the primary loadings are weak. The biggest problem is that excitement seeking is independent of extraversion (-.01). However, even the loadings for impulsivity (.30), vulnerability (.35), openness to feelings (.23), openness to actions (.31), and trust (.28) are low and imply that most of the variance in this facet-factors is not explained by the primary Big Five factor.

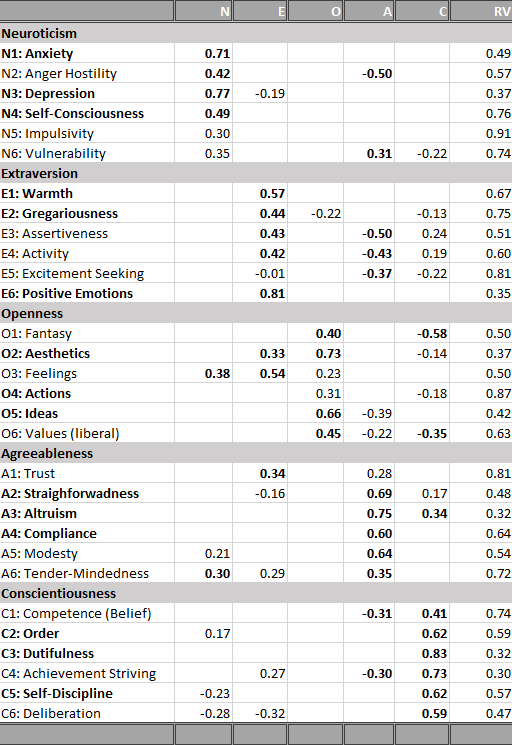
The present results have important implications for theories of the Big Five, which differ in the interpretation of the Big Five factors. For example, there is some debate about the nature of extraversion. To make progress in this research area it is necessary to have a clear and replicable pattern of factor loadings. Given the present results, extraversion seems to be strongly related to experiences of positive emotions (cheerfulness), while the relationship with goal-driven or reward-driven behavior (action, assertiveness, excitement seeking) is weaker. This would suggest that extraversion is tight to individual differences in positive affect or energetic arousal (Watson et al., 1988). As factor loadings can be biased by measurement error, much more research with proper measurement models is needed to advance personality theory. The main contribution of this work is to show that it is possible to use SEM for this purpose.
The last column in Table 6 shows the amount of residual (unexplained) variance in the 30 facets. The average residual variance is 58%. This finding shows that the Big Five are an abstract level of describing personality, but many important differences between individuals are not captured by the Big Five. For example, measurement of the Big Five captures very little of the personality differences in Excitement Seeking or Impulsivity. Personality psychologists should therefore reconsider how they measure personality with few items. Rather than measuring only five dimensions with high reliability, it may be more important to cover a broad range of personality traits at the expense of reliability. This approach is especially recommended for studies with large samples where reliability is less of an issue.
Residual Facet Correlations
Traditional factor analysis can produce misleading results because the model does not allow for correlated residuals. When such residual correlations are present, they will distort the pattern of factor loadings; that is, two facets with a residual correlation will show higher factor loadings. The factor loadings in Table 6 do not have this problem because the model allowed for residual correlations. However, allowing for residual correlations can also be a problem because freeing different parameters can also affect the factor loadings. It is therefore crucial to examine the nature of residual correlations and to explore the robustness of factor loadings across different models. The present results are based on a model that appeared to be the best model in my explorations. These results should not be treated as a final answer to a difficult problem. Rather, they should encourage further exploration with the same and other datasets.
Table 7 shows the residual correlation. First appear the correlations among facets assigned to the same Big Five factor. These correlations have the strongest influence on the factor loading pattern. For example, there is a strong correlation between the warmth and gregariousness facets. Removing this correlation would increase the loadings of these two facets on the extraversion factor. In the present model, this would also produce lower fit, but in other models this might not be the case. Thus, it is unclear how central these two facets are to extraversion. The same is also true for anxiety and self-consciousness. However, here removing the residual correlation would further increase the loading of anxiety, which is already the highest loading facet. This justifies the use of anxiety as the most commonly used indicator of neuroticism.
Table 7. Residual Factor Correlations


It is also interesting to explore the substantive implications of these residual correlations. For example, warmth and gregariousness are both negatively related to self-consciousness. This suggests another factor that influences behavior in social situations (shyness/social anxiety). Thus, social anxiety would be not just high neuroticism and low extraversion, but a distinct trait that cannot be reduced to the Big Five.
Other relationships are make sense. Modesty is negatively related to competence beliefs; excitement seeking is negatively related to compliance, and positive emotions is positively related to openness to feelings (on top of the relationship between extraversion and openness to feelings).
Future research needs to replicate these relationships, but this is only possible with latent variable models. In comparison, network models rely on item levels and confound measurement error with substantial correlations, whereas exploratory factor analysis does not allow for correlated residuals (Schimmack & Grere, 2010).
Conclusion
Personality psychology has a proud tradition of psychometric research. The invention and application of exploratory factor analysis led to the discovery of the Big Five. However, since the 1990s, research on the structure of personality has been stagnating. Several attempts to use SEM (confirmatory factor analysis) in the 1990s failed and led to the impression that SEM is not a suitable method for personality psychologists. Even worse, some researchers even concluded that the Big Five do not exist and that factor analysis of personality items is fundamentally flawed (Borsboom, 2006). As a result, personality psychologists receive no systematic training in the most suitable statistical tool for the analysis of personality and for the testing of measurement models. At present, personality psychologists are like astronomers who have telescopes, but don’t point them to the stars. Imagine what discoveries can be made by those who dare to point SEM at personality data. I hope this post encourages young researchers to try. They have the advantage of unbelievable computational power, free software (lavaan), and open data. As they say, better late than never.
Appendix
Running the model with additional items is time consuming even on my powerful computer. I will add these results when they are ready.
3 thoughts on “A Psychometric Study of the NEO-PI-R”