Category Archives: race IAT

The Race Implicit Association Test Is Biased

This is a preprint (not yet submitted to a journal) of a manuscript that examines the validity of the race IAT as a measure of in-group and out-group attitudes for African and White Americans. We show that research on intergroup relationships and attitudes benefits from insights (insights by means of being inside the experience) by African Americans that are often ignored by White psychologists. Data and Syntax are here (https://osf.io/rvfz8/)

The Race Implicit Association Test is Biased: Most African Americans Have Positive Attitudes Towards Their In-Group

Ulrich Schimmack
University of Toronto Mississauga

Alicia Howard
Music Wellbeing

Abstract

Explicit ratings of attitudes show a preference for the in-group for African Americans and White participants. However, the average score of African Americans on the race Implicit Association Test is close to zero. This finding has been interpreted as evidence that many African Americans have unconsciously internalized negative attitudes towards their group. We conducted a multi-method study of this hypothesis with various implicit measures (Single-Target IAT, Evaluative Priming, Affective Misattribution Procedure) that distinguish between in-group and out-group attitudes. Our main finding is that African Americans have positive attitudes towards their in-group on a latent factor that reflects the valid variance across measures. In addition, the race IAT scores of African Americans are unrelated to in-group and out-group attitudes. Moreover, White American’s race IAT scores are biased and exaggerate in-group preferences. These findings are discussed in terms of the unique aspects of the race IAT that may activate cultural stereotypes. The results have ethical implications for the practice of providing individuals with feedback about their unconscious biases with an invalid measure. It is harmful to African Americans to suggest that they unconsciously dislike African Americans and to exaggerate prejudice of White Americans. Ongoing discrimination may be better explained by explicit prejudice of a minority of White Americans than pervasive, uncontrollable implicit biases of most White Americans.

Introduction

With 1,277 citations in WebOfScience, Jost, Banaji, and Nosek’s (2004) article “A Decade of System Justification Theory: Accumulated Evidence of Conscious and Unconscious Bolstering of the Status Quo” is easily the most cited article in the journal Political Psychology. The second most cited article has less than half the number of citations (523 citations). The abstract of this influential article states the authors’ main thesis clearly and succinctly. They postulate a general motive to support the existing social order. This motive contributes to internalization of inferiority of disadvantaged groups. Most important for this article is the claim that this internalization of inferiority is “observed most readily at an implicit, nonconscious level of awareness” (p. 881).

The theory is broadly applied to a wide range of stigmatized groups and its validity has to be evaluated for each group individually. Our focus is on the African American community. Jost et al. (2004) assume that system justification theory is applicable to African Americans because they show different evaluations of their in-group on explicit measures and on the Implicit Association Test (IAT; Greenwald, McGhee, & Schwartz, 1998). On explicit measures, like the feeling thermometer, African Americans show higher in-group favoritism than White Americans (standardized mean differences d = .8 vs. .6). However, IAT scores show greater in-group favoritism for White Americans than for African Americans (d = .9 vs. 0).  IAT scores close to zero for African Americans have been interpreted as evidence that “sizable proportions of members of disadvantaged groups – often 40% to 50% or even more exhibit implicit (or indirect) biases against their own group and in favor of more advantaged groups” (Jost, 2019, p. 277).

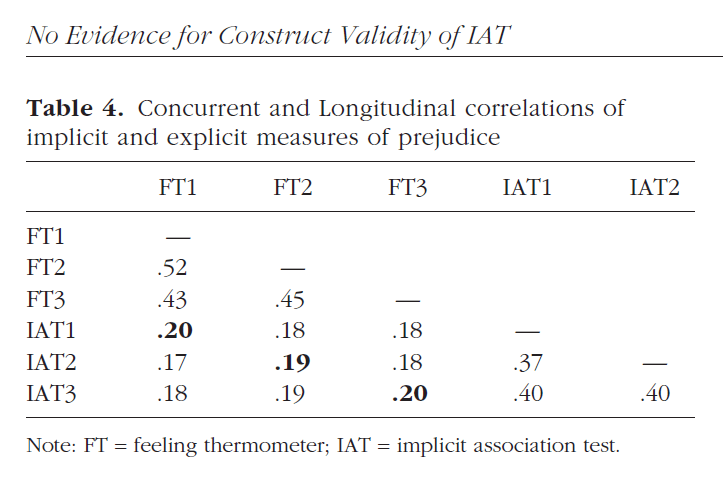
This pattern of results is based on large samples and has been replicated in several studies. Thus, we are not questioning the empirical facts. Our concern is that Jost and colleagues misinterpret these results. In the early 2000s, it was common to assume that explicit and implicit group evaluations reflect different constructs (Nosek, Greenwald, & Banaji, 2005). This dual-attitude model allows for different evaluations of the in-group at a conscious and an unconscious level. Evidence for this model rested mostly on the finding that race IAT scores and self-ratings are only weekly correlated, r ~ .2 (Hofmann, Gawronski, Gschwendner, Le, & Schmitt, 2005). However, these studies did not correct for measurement error. After correcting for measurement error, the correlation increases to r = .8 (Schimmack, 2021a). The race IAT also has little incremental predictive validity over explicit measures (Schimmack, 2021b). This new evidence renders it less likely that explicit and implicit attitudes can diverge. In fact, there exists no evidence that attitudes are hidden from consciousness. Thus, there may be an alternative explanation for African Americans’ scores on the race IAT.

White Psychologists’ Theorizing about African Americans

Before we propose an alternative explanation for African Americans’ neutral scores on the race IAT, we would like to make the observation that Jost et al.’s (2004) claims about African Americans follow a long tradition of psychological research on African Americans by mostly White psychologists. Often this research ignores the lived experience of African Americans, which often leads to false claims (cf. Adams, 2010). For example, since the beginning of psychology, White psychologists assumed that African Americans have low self-esteem and proposed several theories for this seemingly obvious fact. However, in 1986 Rosenberg ironically pointed out that “everything stands solidly in support of this conclusion except the facts.” Since then, decades of research have shown that African Americans have the same or even higher self-esteem than White Americans (Twenge & Crocker, 2002). Just like White theorists’ claims about self-esteem, Jost et al.’s claims about African Americans’ unconscious are removed from African Americans’ own understanding of their culture and identity and disconnected from other findings that are in conflict with the theory’s predictions. The only empirical support for the theory is the neutral score of African Americans on the race IAT.

African American’s Resilience in a Culture of Oppression

We are skeptical about the claim that most African-Americans secretly favor the out-group based on the lived experience of the second author. Alicia Howard is an African-American from a predominantly White, small town in Kentucky. She grew up surrounded by a large family and attended a Black church. Her identity was shaped by role-models from this Black in-group and not by some idealized abstract image of the White out-group. Also, contrary to the famous doll-studies from the 1960s, she had White and Black dolls and got excited when a new Black doll came out. Alicia studied classical music at the historically Black college and university Kentucky State University. Even though her admired composers like Rachmaninov were White, she looked up to Black classical musicians like Andre Watts, Kathleen Battle, Leontyne Price, and Jesse Norman as role models. It is of course possible that her experiences are unique and not representative of African-Americans. However, no one in her family or among her Black friends showed signs that they preferred to be White or liked White people more than Black people. In small towns, the lives of Black and White people are also more similar than in big cities. Therefore, the White out-group was not all that different from the Black in-group. Although there are Black individuals who seem to struggle with their Black identity, there are also White people who suffer from White guilt or assume a Black identity for other reasons. Thus, from an African American perspective, system justification theory does not seem to characterize most African Americans’ attitudes to their in-group.

The Race IAT Could Be Biased

We are not the first to note that the race IAT may not be a pure measure of attitudes (Olson & Fazio, 2004). The nature of the task may activate cultural stereotypes that are normally not activated when African Americans interact with each other. As a result, the mean score of African Americans on the race IAT may be shifted towards a pro-White bias because negative cultural stereotypes persist in US American culture. The same influence of cultural stereotypes would also enhance the pro-White bias for White Americans. Thus, an alternative explanation for the greater in-group bias for White Americans than for African Americans on the race IAT is that attitudes and cultural stereotypes act together for White Americans, whereas they act in opposite directions for African Americans.

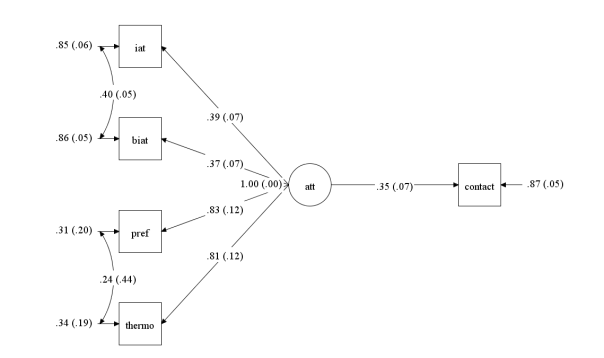
One way to test this hypothesis is to examine in-group biases with alternative implicit measures that do not activate stereotypes. The most widely used alternative implicit measures are the Affective Misattribution Procedure (AMP; Payne, Cheng, Govorun, & Stewart, 2005) and the evaluative priming task (EPT, Fazio, Jackson, Dunton, & Williams, 2005). Only recently it has been noted that these implicit measures produce different results (Teige-Mocigemba, Becker, Sherman, Reichardt, & Klauer, 2017). A study in the United States, examined the differences between African American and White respondents on three implicit measures (Figure 1, Bar-Anan & Nosek, 2014).

Known-group differences are much more pronounced for the race IAT than the other two implicit tasks. The authors interpret this finding as evidence that the race IAT has higher validity. That is, under the assumption that (mostly) White participants have a strong preference for their in-group, a positive mean is predicted, and the more positive the mean is, the more valid a measure is. However, alternative explanations are possible. One alternative explanation is that only the race IAT activates cultural stereotypes and produces a high pro-White mean as a result. In contrast, the other tasks are better measures of attitudes and the results show that prejudice is much less pronounced than the race IAT suggests. That is, the race IAT is biased because it activates cultural stereotypes that are not automatically activated with other implicit tasks.

Another limitation of the race IAT is that preferences for the in-group and the out-group are confounded. In contrast, the other two tasks can be scored separately to obtain measures of the strength of preferences for the in-group and the out-group. This is particularly helpful to make sense of the neutral score of African Americans on the race IAT. One explanation for a weaker in-group bias is simply that African Americans are less biased against the out-group than White Americans. Thus, a better test of African Americans’ attitudes towards their own group is to examine how positive or negative African American’s responses are to African American stimuli.

In short, published studies reveal that different implicit tasks produce different results and that the race IAT shows stronger pro-White biases than other tasks. However, it has not been systematically explored whether this finding reveals higher or lower validity of the race IAT. We used Bar-Anan and Nosek’s (2014) data to explore this question.

Method

Data

The data are based on a voluntary online sample. The total sample size is large (N = 23,413).  However, participants completed only some of the tasks that included implicit measures of political orientation and self-esteem. Table 1 shows the number of African American and White participants for six measures.

Measures

Race IAT.  The race IAT is the standard Implicit Association Test, although the specific stimuli that represent the African American group and the White American group were different. However, this does not appear to have influenced responses as seen by similar means for African American and White American participants.  The race IAT was scored so that higher values represented a pro-White bias for White participants and a pro-Black bias for Black participants.

Single Target IAT. The single-target IAT (ST-IAT) is a variation of the race IAT. The main difference is that participants only have to classify one racial group along with classifications of positive and negative stimuli. As a result, the ST-IAT reflects only evaluations of one group and provides distinct information about evaluations of the in-group and out-group. It is particularly interesting how Black participants perform on the in-group ST-IAT with Black targets. System justification theory predicts a score close to zero that would reflect an over all neutral attitude and at least 50% of participants who may hold negative views of the in-group. 

Evaluative Priming Task. The Evaluative Priming Task (EPT) was developed by Fazio et al. (1995). In a practice block, participants classified words as “good” or “bad.” In the next three blocks, target stimuli were primed with pictures of African American and White Americans. In-group bias was the response time to same-group primes for negative words minus response times to same-group primes for positive words. Out-group bias was the response time to other-group primes for negative words minus response times to other-group primes for positive words.

Affective Misattribution Procedure. The Affective Misattribution was invented by Payne et al. (2005). Pictures of African Americans or White Americans are quickly followed by a Chinese character and a mask. Participants are instructed to rate the Chinese character as more or less pleasant than the average Chinese character. They were instructed not to let the pictures influence their evaluation of the target stimuli. The in-group score was the percentage of more pleasant responses after an in-group picture. The out-group score was the percentage of more pleasant responses after an out-group picture.

Feeling Thermometer. Self-reports of in-group and out-group attitudes were measured with feeling thermometers. Participants rated how warm or cold they feel toward the in-group and the out-group on an 11-point scale ranging from 0 = coldest feelings to 10 = warmest feelings.

For all measures, participants scores were divided by the standard deviation so that means can be interpreted as standardized effect sizes assuming that a mean of zero reflects a neutral attitude, positive scores reflect positive attitudes, and negative scores reflect negative attitudes.

Results

The data were analyzed using structural equation modeling with MPLUS8.2 (Muthen & Muthen (2017), A multi-group model was specified with African Americans and White Americans as separate groups. The model was developed iteratively using the data. Thus, all results are exploratory and require validation in a separate sample. Due to the small number of Black participants, it was not possible to cross-validate the model with half of the sample. Moreover, tests of group differences have low power and a study with a larger sample of African Americans is needed to test equivalence of parameters. Cherry picking of data, models, and references undermines psychological science. To avoid this problem, we also constructed a model that assumes some implicit measures are biased and inflate in-group attitudes of African Americans. To identify the means of the latent in-group and out-group factors, we chose the single-target IAT because it shows the least positive attitudes of African Americans towards their in-group. We then freed other parameters to maximize model fit. We then freed other parameters to maximize model fit. The data, input syntax, and the full outputs have been posted online (https://osf.io/rvfz8/).

Preferred Model

Overall fit of the final model meets standard fit criteria (RMSEA < .06, CFI > .95), CFI (78) = 133.37, RMSEA = .012, 90%CI = .009 to .016, CFI = .981. However, models with low coverage (many missing data) may overestimate model fit. A follow-up study that administers all tasks to all participants should be conducted to provide a stronger test of the model. Nevertheless, the model is parsimonious and there were no modification indices greater than 20. This suggests that there are no major discrepancies between the model and the data.

Figure 2 shows a measurement of attitudes towards the in-group and out-group. The key unobserved variables in this model are the attitude towards the in-group factor (ig) and the attitude towards the out-group factor (og). Each construct is measured with four indicators, namely scores on the single-target IAT (satig/satog), scores on the evaluative priming task (epig, epog), scores on the affective misattribution procedure (ampig/ampog), and scores on the explicit feeling thermometer ratings (thermoig/thermoog). For ease of interpretation, Figure 2 shows standardized coefficients that range from -1 to 1.

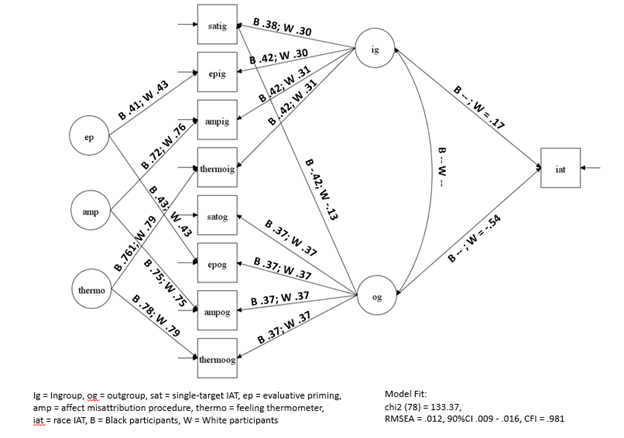
The first finding is that loadings of the measures on the IG factor (.3-.4) and on the outgroup factor (.4) are modest. They suggest that less than 20% of the variance in a single measure is valid variance. However, the model clearly identified latent factors that show individual differences in attitudes towards in-group and out-group for Black and White Americans. The second noteworthy finding is that loadings for African Americans and White Americans were similar. Thus, the multi-method measurement model was able to identify variation in in-group and out-group attitudes for both groups.

A third finding is that for White participants.54^2 = 29% of the variance in race IAT reflects attitudes towards African Americans (i.e., prejudice). This is a bit higher than previous estimates, which were in the 10% to 20% range (Schimmack, 2021). However, the lower limit of the 95%CI overlapped with this range of possible values, .43^2 = 18%.

Most important is the finding that race IAT scores for African Americans were unrelated to the attitudes towards the in-group and out-group factors. Thus, scores on the race IAT do not appear to be valid measures of African Americans’ attitudes. This finding has important implications for Jost et al.’s (2021) reliance on race IAT scores to make inferences about African Americans’ unconscious attitudes towards their in-group. This interpretation assumed that race IAT scores do provide valid information about African American’s attitudes towards the in-group, but no evidence for this assumption was provided. The present results show 20 years later that this fundamental assumption is wrong. The race-IAT does not provide information about African Americans’ attitudes towards the in-group as reflected in other implicit measures.

An additional interesting finding was that in-group and out-group attitudes were unrelated. This suggests that prejudice does not enhance pro-White attitudes for White participants. It also suggests that Black pride does not have to devalue the White outgroup.

Finally, the model shows that three methods show strong method variance. All three methods measured in-group and out-group attitudes within a single experimental block. The main difference is the single-target IAT that is conducted once with one target (Black) and once with the other target (White). Separating the assessment of in-group and out-group attitudes for the other tasks might reduce the amount of systematic measurement error. However, less systematic measurement error does not seem to translate into more valid variance as the single-target IAT was not more valid than the other measures. The results for the commonly used feeling thermometer are particularly noteworthy. While this measure shows some modest validity, the present results also show that this single-item measure has poor psychometric properties. An important goal for future research is to develop more valid measures of attitudes towards in-groups and out-groups. Until then, researchers should use a multi-method approach.  

Figure 3 shows the model for the means. While standardized coefficients are easier to interpret for the measurement model, means are easier to interpret in the units of the measures, which were scaled so that means can be interpreted as Cohen’s d values.

The most important finding is that African Americans’ mean for the in-group factor is positive, d = 1.07, 95%CI = 0.98 to 1.16. Thus, the data provide no support for the claim that most African Americans evaluate their in-group negatively. With a normal distribution centered at 1.07, only 14% of African Americans would have a negative (below 0) attitude towards the in-group. White Americans also show a positive evaluation of the in-group, but to a lesser extent, d = 0.62; 95%CI = 0.58, 0.66. The confidence intervals are tight and clearly do not overlap, and constraining these two coefficients to be equal reduced model fit, chi2(79) = 228.43, Δchi2(1) = 95.06, p = 1.85e-22.  Thus, this model suggests that African Americans have an even more positive attitude towards their in-group than White Americans.

As expected, out-group attitudes are less positive than in-group attitudes for both groups. Also expected was the finding that out-group attitudes of African Americans, d = .42, 95%CI , are more favorable than out-group attitudes of White Americans, d = .20, 95%CI. However, even White Americans’ out-group attitudes are on average positive. This finding is in marked contrast to the common finding with the race IAT that most White Americans show a pronounced pro-White bias, which has often been interpreted as evidence of widespread prejudice. However, this interpretation is problematic for two reasons. First, it confounds in-group and out-group attitudes. Prejudice is defined as White American’s attitude towards African Americans. The race IAT is not a direct measure of prejudice because it measures relative preferences. Of course, in-group favoritism alone can lead to discrimination and racial disparities when one group is dominant, but these consequences can occur without actual prejudice against African Americans. The present results suggest that African American also have an in-group bias. Thus, it is important to distinguish between in-group favoritism, which applies to both groups, from prejudice which applies uniquely to White Americans towards African Americans.

The bigger problem for the race IAT is that White Americans’ scores on the race IAT are systematically biased towards a pro-White score, d = .78, whereas African Americans’ scores are only slightly biased towards a pro-Black score, d = -.19. This finding shows that IAT scores provide misleading information about the amount of in-group favoritism. Thus, support for the system justification theory rests on a measurement artifact.

Alternative Model

It is possible that our modeling decisions exaggerated the positivity of African Americans’ in-group attitudes. To address this concern, we tried to find an alternative model that fits the data with the lowest amount of African American’s in-group bias. This alternative model fit the data as well as our preferred model, CFI (77) = 134.24, RMSEA = .013, 90%CI = .009 to .016, CFI = .980. Thus, the data cannot distinguish between these two models. The covariance structure was identical. Thus, we only present the means structure of the model (Figure 4).

The main difference between the models is that African Americans’ attitudes towards the ingroup are less favorable (d = 1.07 vs. d = .54). The discrepancy is explained by the assumptions that African Americans have a positive bias on the feeling-thermometer and by assuming that African Americans’ responses to White targets on the AMP are negatively biased (ampog = -.72). The most important finding is that African Americans’ in-group attitudes remain positive, d = .54, although they are now slightly less favorable than White Americans’ in-group attitudes, d = .62.  

Proponents of system justification theory might argue that attitudes towards the in-group have to be evaluated in relative terms. Viewed from this perspective, the results still show relatively more in-group favoritism for White Americans, d = .62 – .20 = .42 than African Americans, d = .54 – .40 = .14. However, out-group attitudes contribute more to this difference, d = .40 = .20 = .20, than in-group differences, d = .62 – .54 = .08. Thus, one reason for the difference in relative preferences is that African Americans attitudes towards Whites are more positive than White Americans’ attitudes towards African Americans. It would be a mistake to interpret this difference in evaluations of the out-group as evidence that African Americans have internalized negative stereotypes about their in-group.

The alternative model does not alter the fact that scores on the race IAT are biased and provide misleading information about in-group and out-group attitudes.

Discussion

After its introduction in 1998, the Implicit Association Test has been quickly accepted as a valid measure of attitudes that individuals are unwilling or unable to report on self-report measures. Mean scores of White Americans were interpreted as evidence that prejudice is much more widespread and severe than self-report measures suggest. Mean scores of African Americans were interpreted as evidence of unconscious self-loathing. The present results suggest that millions of African American and White visitors of the Project Implicit website were given false feedback about their attitudes. For White Americans, the race IAT does appear to reflect individual differences in out-group attitudes (prejudice). However, the scoring of the IAT in terms of deviations from a value of zero is invalid because the mean is biased towards pro-White scores. Even the amount of valid variation is modest and insufficient to provide individualized feedback.

Implications for African American’s In-Group and Out-Group Attitudes

Our investigation started with the surprising suggestions that African Americans are motivated to justify racism and are supposed to have internalized negative stereotypes and attitudes towards their group. This view of African Americans is detached from their history and evidence of high self-esteem among African Americans. The only evidence for this claim was the finding that African Americans do not show a strong in-group preference on the race IAT.

Our results suggest that this finding is due to the low validity of the race IAT as a measure of African Americans’ attitudes. African American’s race IAT scores were unrelated to their in-group attitudes and out-group attitudes as measured by other measures, including the single-target variant of the IAT.

This raises the question in which way the race IAT differs from other measures. We are not the first to suggest that the race IAT activates negative cultural stereotypes (Olson & Fazio, 2004). These stereotypes are known to African Americans and may influence their performance on the IAT, even if African Americans do not endorse these stereotypes and these stereotypes are rarely activated in real life. Thus, the mean close to zero may not reflect the fact that 50% of African Americans have negative attitudes towards their group. Rather, it is possible that the neutral score reflects a balanced influence of positive attitudes and negative stereotypes.

Another noteworthy difference between other implicit tasks and the race IAT is that other tasks rely on pictures of individual members to elicit a valenced response. In contrast, the race IAT focuses on the evaluation of the abstract category “Black.” It is possible that African Americans have more positive attitudes to (pictures of) members of the group than to the concept of being “Black,” which is a fuzzy category at best. Similarly, old people seem to have a negative attitude to the concept of being “old,” but this does not imply that they do not like old people. This has important implications for the predictive validity of the IAT. In everyday life, we encounter individuals and not abstract categories. Thus, even if the race IAT were a valid measure of attitudes towards abstract categories, it would be a weak predictor of actual behaviors.

In sum, the only empirical support for system justification theory was African Americans’ neutral score on the race IAT. We show that the race IAT lacks validity and that African Americans have positive attitudes towards their in-group on all other measures. We also find that they have positive attitudes towards the White outgroup. This has important implications for the assessment of racial attitudes of White participants. If most White participants have negative attitudes towards Black people and these attitudes consistently influence White Americans behaviors, African Americans would experience discrimination from most White Americans. In this case, we would expect negative attitudes towards the out-group. As the data show, this is not the case. This does not mean that discrimination is rare. Rather, it is possible that most acts of discrimination are committed by a relatively small group of White Americans (Campbell & Brauer, 2021).

Implications for White American’s In-Group and Out-Group Attitudes

Banaji and Greenwald’s (2013) popular book was largely responsible for claims that implicit bias is real, widespread, and explains racial discrimination. The book ends with several conclusions. Two conclusions are widely accepted among social psychologists and a majority of US Americans, namely Black disadvantage exists and racial discrimination at least partially contributes to this disadvantage. However, other conclusions were not generally accepted and were not clearly supported by evidence, namely attitudes have both reflective and automatic form, people are often unaware of their automatic attitudes, and implicit bias is pervasive, and implicit racial attitudes contribute to discrimination against Black Americans. The claim that implicit biases are widespread was based entirely on the finding that 75% of US Americans show a clear pro-White bias on the race IAT. The present results suggest that this finding is unique to the race IAT and not found with other implicit measures.

Once more, we are not the first to point out that scoring of the race IAT may have exaggerated the pervasiveness of racial biases among White Americans (Blanton et al., 2006, 2009, 2015; Oswald et al., 2013, 2015). However, so far this criticism has fallen on deaf ears and Project Implicit continues to provide individuals with feedback about their race IAT scores. Textbooks proudly point out that over 20 million people have received this feedback, as if this number says something about the validity of the test (Myers & Twenge, 2019).

When visitors might see a discrepancy between their self-views and the test scores, they are informed that this does not invalidate the test because it measures something that is hidden from self-knowledge. The present results suggest that many visitors of the Project Implicit website were given false feedback about their prejudices because even individuals without any negative attitudes towards African Americans end up with a pro-White bias on the race IAT.

This bias can co-exist with evidence that variation in race IAT scores shows some convergent validity with other explicit and implicit measures of individual differences in attitudes towards African Americans. However, variances and means are two independent statistical constructs, and valid variance does not imply that means are valid. Nosek and Bar-Anan (2014) argued that the race IAT is the most valid measure of attitudes because it shows the largest differences in scores between African Americans and White Americans. However, this argument is only valid, if we assume that random measurement error attenuates the differences on other measures. The present study directly tested this assumption and found no evidence for the assumption. Instead, we found that the larger differences between African Americans and White Americans reflects some systematic mean differences that are unique to the race IAT. As noted earlier, a plausible explanation for this systematic bias is that the race IAT activates stereotypes, whereas other measures are purer measures of attitudes.

We hope that our direct demonstration of bias will finally end the practice of providing visitors of the Project Implicit website with misleading information about the validity of the race IAT and misleading information about individuals’ prejudice. There is simply no evidence that prejudice is hidden from honest self-reflection or that such hidden biases are revealed by the race IAT (Schimmack, 2021).

Implications for Future Research

Although our article focuses on the race IAT, the results also have implications for the use and interpretation of the other measures. One advantage of the other measures is that they provide separate information about in-group and out-group attitudes because they avoid the pitting of one group against the other. However, these measures have other problems. Fast reactions to pictures of African Americans and White Americans reflect only first impressions without context. They are also influenced by affective reactions to other aspects such as gender, age, or attractiveness. Thus, these scores may not reflect other aspects of attitudes that are activated in specific contexts. Moreover, the means will depend heavily on the selection of individual pictures. Thus, a lot more work would need to be done to ensure that the picture sets are representative of the whole group. Finally, our results showed that none of the measures had high loadings on the attitude factors. Thus, a single measure has only modest validity.

Unfortunately, psychologists often do not carefully examine the psychometric properties of their measures. Instead, one measure is often arbitrarily chosen and treated as if it were a perfect measure of a construct. Even worse, a specific measure may be chosen from a set of measures because it showed the desired result (John, Loewenstein, & Prelec, 2012). To avoid these problems, we strongly urge intergroup relationship researchers to use a multi-method approach and to use formal measurement models to analyze their data (Schimmack, 2021). This approach will also produce better estimates of effect sizes that are attenuated by random and systematic measurement error.

References

Adams, P. E. (2010). Understanding the Different Realities, Experience, and Use of Self-Esteem Between Black and White Adolescent Girls. Journal of Black Psychology, 36(3), 255–276. https://doi.org/10.1177/0095798410361454

Banaji, M. R., & Greenwald, A. G. (2013). Blindspot: Hidden biases of good people. New York, NY: Delacorte Press.

Bar-Anan, Y., & Nosek, B. A. (2014). A comparative investigation of seven indirect attitude measures. Behavior Research Methods, 46(3), 668–688. https://doi.org/10.3758/s13428-013-0410-6

Blanton, H., Jaccard, J., Gonzales, P. M., & Christie, C. (2006). Decoding the implicit association test: Implications for criterion prediction. Journal of Experimental Social Psychology, 42(2), 192–212. https://doi.org/10.1016/j.jesp.2005.07.003

Blanton, H., Jaccard, J., Klick, J., Mellers, B., Mitchell, G., & Tetlock, P. E. (2009). Strong claims and weak evidence: Reassessing the predictive validity of the IAT. Journal of Applied Psychology, 94(3), 567–582.

Blanton, H., Jaccard, J., Strauts, E., Mitchell, G., & Tetlock, P. E. (2015). Toward a meaningful metric of implicit prejudice. Journal of Applied Psychology, 100(5), 1468–1481. https://doi.org/10.1037/a0038379

Campbell, M. R., & Brauer, M. (2021). Is discrimination widespread? Testing assumptions about bias on a university campus. Journal of Experimental Psychology: General, 150(4), 756–777. https://doi.org/10.1037/xge0000983

Fazio, R. H., Jackson, J. R., Dunton, B. C., & Williams, C. J. (1995). Variability in automatic activation as an unobtrusive measure of racial attitudes: A bona fide pipeline? Journal of Personality and Social Psychology, 69(6), 1013–1027. https://doi.org/10.1037/0022-3514.69.6.1013

Greenwald, A. G., McGhee, D. E., & Schwartz, J. L. K. (1998). Measuring individual differences in implicit cognition: The Implicit Association Test. Journal of Personality and Social Psychology, 74, 1464–1480.

John, L. K., Loewenstein, G., & Prelec, D. (2012). Measuring the prevalence of questionable research practices with incentives for truth telling. Psychological Science, 23(5), 524–532. https://doi.org/10.1177/0956797611430953

Jost, J. T. (2019). A quarter century of system justification theory: Questions, answers, criticisms, and societal applications. British Journal of Social Psychology, 58(2), 263–314. https://doi.org/10.1111/bjso.12297

Jost, J. T., Banaji, M. R., & Nosek, B. A. (2004). A Decade of System Justification Theory: Accumulated Evidence of Conscious and Unconscious Bolstering of the Status Quo. Political Psychology, 25(6), 881–919. https://doi.org/10.1111/j.1467-9221.2004.00402.x

Hofmann, W., Gawronski, B., Geschwendner, T., Le, H., & Schmitt, M. (2005). A meta-analysis on the correlation between the Implicit Association Test and explicit self-report measures. Personality and Social Psychology Bulletin, 31, 1369–1385. doi:10.1177/0146167205275613

Muthén, L.K. and Muthén, B.O. (1998-2017). Mplus User’s Guide. Eighth Edition. Los Angeles, CA: Muthén & Muthén

Myers, D. & Twenge, J. (2019). Social psychology (13th edition). McGraw Hill.

Nosek, B. A., Greenwald, A. G., & Banaji, M. R. (2005). Understanding and Using the Implicit Association Test: II. Method Variables and Construct Validity. Personality and Social Psychology Bulletin, 31(2), 166–180. https://doi.org/10.1177/0146167204271418

Olson, M. A., & Fazio, R. H. (2004). Reducing the Influence of Extrapersonal Associations on the Implicit Association Test: Personalizing the IAT. Journal of Personality and Social Psychology, 86(5), 653–667. https://doi.org/10.1037/0022-3514.86.5.653

Oswald, F. L., Mitchell, G., Blanton, H., Jaccard, J., & Tetlock, P. E. (2013). Predicting ethnic and racial discrimination: A meta-analysis of IAT criterion studies. Journal of Personality and Social Psychology, 105(2), 171–192. https://doi.org/10.1037/a0032734

Oswald, F. L., Mitchell, G., Blanton, H., Jaccard, J., & Tetlock, P. E. (2015). Using the IAT to predict ethnic and racial discrimination: Small effect sizes of unknown societal significance. Journal of Personality and Social Psychology, 108(4), 562–571. https://doi.org/10.1037/pspa0000023

Payne, B. K., Cheng, C. M., Govorun, O., & Stewart, B. D. (2005). An inkblot for attitudes: Affect misattribution as implicit measurement. Journal of Personality and Social Psychology, 89(3), 277–293. https://doi.org/10.1037/0022-3514.89.3.277

Rosenberg, M. (1986). Conceiving the self. Malabar, FL: Robert E. Krieger.

Schimmack, U. (2021a). The Implicit Association Test: A Method in Search of a Construct. Perspectives on Psychological Science, 16(2), 396–414. https://doi.org/10.1177/1745691619863798

Schimmack, U. (2021). Invalid Claims About the Validity of Implicit Association Tests by Prisoners of the Implicit Social-Cognition Paradigm. Perspectives on Psychological Science, 16(2), 435–442. https://doi.org/10.1177/1745691621991860

Teige-Mocigemba, S., Becker, M., Sherman, J. W., Reichardt, R., & Christoph Klauer, K. (2017). The affect misattribution procedure: In search of prejudice effects. Experimental Psychology, 64(3), 215–230. https://doi.org/10.1027/1618-3169/a000364

Twenge, J. M., & Crocker, J. (2002). Race and self-esteem: Meta-analyses comparing Whites, Blacks, Hispanics, Asians, and American Indians and comment on Gray-Little and Hafdahl (2000). Psychological Bulletin, 128(3), 371–408. https://doi.org/10.1037/0033-2909.128.3.371

Invalid Claims about the Validity of Implicit Association Tests

Citation:
Schimmack, U. (2021). Invalid Claims About the Validity of Implicit Association Tests by Prisoners of the Implicit Social-Cognition Paradigm. Perspectives on Psychological Science, 16(2), 435–442. https://doi.org/10.1177/1745691621991860

This post has been revised on March 12, 2021 to make it consistent with the published version (https://doi.org/10.1177/1745691621991860) of my response to commentaries by Vianello and Bar-Anan and Kurdi, Ratliff, and Cunningham in response to my target article about the lack of construct validity of IATs (Schimmack, 2021).

Invalid Claims about the Validity of Implicit Association Tests by Prisoners of the Implicit Social-Cognition Paradigm

Abstract
In a prior publication, I used structural equation modeling of multimethod data to examine the construct validity of Implicit Association Tests. The results showed no evidence that IATs measure implicit constructs (e.g., implicit self-esteem, implicit racial bias). This critique of IATs elicited several responses by implicit social-cognition researchers, who tried to defend the validity and usefulness of IATs. I carefully examine these arguments and show that they lack validity. IAT proponents consistently ignore or misrepresent facts that challenge the validity of IATs as measures of individual differences in implicit cognitions. One response suggests that IATs can be useful even if they merely measure the same constructs as self-report measures, but I find no support for the claim that IATs have practically significant incremental predictive validity. In conclusions, IATs are widely used without psychometric evidence of construct or predictive validity.

Keywords
implicit attitudes, Implicit Association Test, validity, prejudice, suicide, mental health

Greenwald and colleagues (1998) introduced Implicit Association Tests (IATs) as a new method to measure individual differences in implicit cognitions. Twenty years later, IATs are widely used for this purpose, but their construct validity has not been established. Even its creator is no longer sure what IATs measure. Whereas Banaji and Greenwald (2013) confidently described
IATs as “a method that gives the clearest window now available into a region of the mind that is inaccessible to question-asking methods” (p. xiii), they now claim that IATs merely measure “the strengths of associations among concepts” (Cvencek et al., 2020, p. 187). This is akin to saying that an old-fashioned thermometer measures the expansion of mercury: It is true, but it has little to do with thermometers’ purpose of measuring temperature.

Fortunately, we do not need Greenwald or Banaji to define the constructs that IATs are supposed to measure. Twenty years of research with IATs makes it clear what researchers believe they are measuring with IATs. A self-esteem IAT is supposed to measure implicit self-esteem (Greenwald & Farnham, 2000). A race IAT is supposed to measure implicit prejudice (Cunningham et al., 2001), and a suicide IAT is supposed to measure implicit suicidal tendencies that can predict suicidal behaviors above and beyond self-reports (Kurdi et al.,
2021). The empirical question is whether IATs are any good at measuring these constructs. I concluded that most IATs are poor measures of their intended constructs (Schimmack, 2021). This conclusion elicited one implicit and two explicit responses.

Implicit Response

The implicit response is to simply ignore criticism and to make invalid claims about the construct validity of IATs (Greenwald & Lai, 2020). For example, a 2020 article coauthored by Nosek, Greenwald, and Banaji (among others) claimed that “available evidence for validity of
IAT measures of self-esteem is limited (Bosson et al., 2000; Greenwald & Farnham, 2000), with some of the strongest evidence coming from empirical tests of the balance-congruity principle” (Cvencek et al., 2020, p. 191). This statement is as valid as Donald Trump’s claim that an honest count of votes would make him the winner of the 2020 election. Over the past 2 decades, several articles have concluded that self-esteem IATs lack validity (Buhrmester et al., 2011; Falk et al., 2015; Walker & Schimmack, 2008). It is unscientific to omit these references from a literature review.

The balance-congruity principle is also not a strong test of the claim that the self-esteem IAT is a valid measure of individual differences in implicit self-esteem. In contrast, the lack of convergent validity with informant ratings and even other implicit measures of
self-esteem provides strong evidence that self-esteem IATs are invalid (Bosson et al., 2000; Falk et al., 2015). Finally, supporting evidence is surprisingly weak. For example, Greenwald and Farnham’s (2000) highly cited article tested predictive validity of the self-esteem IAT with responses to experimentally manipulated successes and failures (n = 94). They did not even report statistical results. Instead, they suggested that even nonsignificant results should be counted as evidence for the validity of the self-esteem IAT:

Although p values for these two effects straddled the p = .05 level that is often treated as a boundary between noteworthy and ignorable results, any inclination to dismiss these findings should be tempered by noting that these two effects agreed with prediction in both direction and shape. (Greenwald & Farnham, 2000, p. 1032)

Twenty years later, this finding has not been replicated, and psychologists have learned to distrust p values that are marginally significant (Benjamin et al., 2018; Schimmack, 2012, 2020). In conclusion, conflict of interest and motivated biases undermine the objectivity of Greenwald and colleagues in evaluations of IATs’ validity.

Explicit Response 1

Vianello and Bar-Anan (2021) criticized my structural equation models of their data. They also presented a new model that appeared to show incremental predictive validity for implicit racial bias and implicit political orientation. I thought it would be possible to resolve some of the disagreement in a direct and open communication with the authors because the disagreement
is about modeling of the same data. I was surprised when the authors declined this offer, given that Bar- Anan coauthored an article that praised the virtues of open scientific communication (Nosek & Bar-Anan, 2012). Readers therefore have to reconcile conflicting viewpoints for themselves. To ensure full transparency, I published syntax, outputs, and a detailed discussion
of the different modeling assumptions on OSF at https://osf.io/wsqfb/.

In brief, a comparison of the models shows that mine is more parsimonious and has better fit than their model. Because the model is more parsimonious, better fit cannot be attributed to overfitting of the data. Rather, the model is more consistent with the actual data, which in most sciences is considered a good reason to favor a model. Vianello and Bar-Anan’s model also produced unexplained, surprising results. For example, the race IAT has only a weak positive loading on the IAT method factor, and the political-orientation IAT even has a moderate negative loading. It is not clear how a method can have negative loadings on a method factor,
and Vianello and Bar-Anan provided no explanation for this surprising finding.

The two models also produce different results regarding incremental predictive validity (Table 1). My model shows no incremental predictive validity for implicit factors. It is also surprising that Vianello and Bar-Anan found incremental predictive validity for voting behaviors,
because the explicit and implicit factors correlated (r) at .9. This high correlation leaves little room for variance in implicit political orientation that is distinct from political orientation measured with self-ratings.

In conclusion, Vianello and Bar-Anan failed to challenge my conclusion that implicit and explicit measures measure mostly the same constructs and that low correlations between explicit and implicit measures reflect measurement error rather than some hidden implicit processes.

Explicit Response 2

The second response (Kurdi et al., 2021) is a confusing 7,000-word article that is short of facts, filled with false claims, and requires more fact-checking than a Trump interview.

False fact 1

The authors begin with the surprising statement that my findings are “not at all incompatible with the way that many social cognition researchers have thought about the construct of (implicit) evaluation” (p. 423). This statement is misleading. For 3 decades, social-cognition
researchers have pursued the idea that many social-cognitive processes that guide behavior occur outside of awareness. For example, Nosek et al. (2011) claim “most human cognition occurs outside conscious awareness or conscious control” (p. 152) and go on to claim that IATs “measure something different from self-report” (p. 153). And just last year, Greenwald and Lai
(2020) claimed that “in the last 20 years, research on implicit social cognition has established that social judgments and behavior are guided by attitudes and stereotypes of which the actor may lack awareness” (p. 419).

Social psychologists have also been successful in making the term implicit bias a common term in public discussions of social behavior. The second author, Kathy Ratliff, is director of Project Implicit, which “has a mission to develop and deliver methods for investigating and applying phenomena of implicit social cognition, including especially phenomena of implicit bias based on age, race, gender or other factors” (Kurdi et al., 2021, p. 431). It is not clear what this statement means if we do not make a distinction between traditional research on prejudice with self-report measures and the agenda of Project Implicit to study implicit biases with IATs.
In addition, all three authors have published recent articles that allude to IATs as measures of implicit cognitions.

In a highly cited American Psychologist article, Kurdi and coauthors (2019) claim “in addition to dozens of studies that have established construct validity . . . investigators have asked to what extent, and under what conditions, individual differences in implicit attitudes, stereotypes, and identity are associated with variation in behavior toward individuals as a function of their social group membership” (p. 570). The second author coauthored an article with the claim that “Black participants’ implicit attitudes reflected no ingroup/ outgroup preference . . . Black participants’ explicit attitudes reflected an ingroup preference” ( Jiang et al.,
2019). In 2007, Cunningham wrote that the “distinction between automatic and controlled processes now lies at the heart of several of the most influential models of evaluative processing” (Cunningham & Zelazo, 2007, p. 97). And Cunningham coauthored a review article with the claim that “a variety of tasks have been used to reflect implicit psychopathology associations, with the IAT (Greenwald et al., 1998) used most widely” (Teachman
et al., 2019). Finally, many users of IATs assume that they are measuring implicit constructs that are distinct from constructs that are measured with self-ratings. It is therefore a problem for the construct validity of IATs if they lack discriminant validity. At the least, Kurdi et al. fail to explain why anybody should use IATs if they merely measure the same constructs that can be
measured with cheaper self-ratings. In short, the question whether IATs and explicit measures reflect the same constructs or different constructs has theoretical and empirical relevance, and lack of discriminant validity is a problem for many theories of implicit cognitions (but see Cunningham & Zelazo, 2007).

False fact 2

A more serious false claim is that I found “high correlations between relatively indirect (automatic) measures of mental content, as indexed by the IAT, and relatively direct (controlled) measures of mental content, as indexed by a variety of self-report scales” (p. 423). Table 2 shows some of the correlations among implicit and explicit measures in Vianello and Bar-Anan’s data. Only one of these correlations meets the standard criterion of a high correlation (i.e., r = .5; Cohen, 1988). The other correlations are small to moderate. These correlations show at best moderate convergent validity and no evidence of discriminant validity (i.e., higher implicit-implicit than implicit-explicit correlations). Similar results have been reported since the first IATs were created (Bosson et al., 2000). For 20 years, IAT researchers have ignored these low correlations and made grand claims about the validity of IATs. Kurdi et al. are doubling
down on this misinformation by falsely describing these correlations as high.

False fact 3

The third false claim is that “plenty of evidence in favor of dissociations between direct and indirect measures exists” (p. 428). To support this claim, Kurdi et al. cite a meta-analysis of incremental predictive validity (Kurdi et al., 2019). There are several problems with this claim.
First, the meta-analysis corrects only for random measurement error and not systematic measurement error. To the extent that systematic measurement error is present, incremental validity will shrink because explicit and implicit factors are very highly correlated when both sources of error are controlled (Schimmack, 2021). Second, Kurdi et al. fail to mention effect sizes. The meta-analysis suggests that a perfectly reliable IAT would explain about 2% unique variance. However, IATs have only modest reliability. Thus, manifest IAT scores would explain even less unique variance. Finally, even this estimate has to be interpreted with caution because the meta-analysis did not correct for publication bias and included some questionable studies. For example, Phelps et al. (2003) report, among 12 participants, a correlation of .58 between scores on the race IAT and differences in amygdala activation in response to Black and White faces. Assuming 20% valid variance in the IAT scores (Schimmack, 2021), the validation- corrected correlation would be 1.30. In other words, a correlation of .58 is impossible given the low validity of race-IAT scores. It is well known that correlations in functional MRI studies with small samples are not credible (Vul et al., 2009). Moreover, brain activity is not a social behavior. It is therefore unclear why studies like this were included in Kurdi et al.’s (2019) meta-analysis.

Kurdi et al. also used suicides as an important outcome that can be predicted with suicide and death IATs. They cited two articles to support this claim. Fact checking shows that one article reported a statistically significant result (p = .013; Barnes et al., 2017), whereas the other one did not (p > .50; Glenn et al., 2019). I conducted a meta-analysis of all studies that reported incremental predictive validity of suicide or death IATs. The criterion was suicide attempts in the next 3 to 6 months (Table 3). I found eight studies, but six of them came from a single lab (Matthew K. Nock). Nock was also the first one to report a significant result in an extremely underpowered study that included only two suicide attempts (Nock & Banaji, 2007). Five of the eight studies showed a statistically significant result (63%), but the average observed power to achieve significance was only 42%. This discrepancy suggests the presence of publication bias (Schimmack, 2012). Moreover, significant results are all clustered around .05, and none
of the p values meets the stricter criterion of .005 that has been suggested by Nosek and others to claim a discovery (Benjamin et al., 2018). Thus, there is no conclusive evidence to suggest that suicide IATs have incremental predictive validity in the prediction of suicides. This is not surprising because most of the studies were underpowered and unlikely to detect small effects.
Moreover, effect sizes are bound to be small because the convergent validity between suicide and death IATs is low (r = .21; Chiurliza et al., 2018), suggesting that most of the variance in these IATs is measurement error.

In conclusion, 20 years of research with IATs has produced no credible and replicable evidence that IATs have incremental predictive validity over explicit measures. Even if there is some statistically significant incremental predictive validity, the amount of explained
variance may lack practical significance (Kurdi et al., 2019).

False fact 4

Kurdi et al. (2021) object (p. 424) to my claim that “most researchers regard the IAT as a valid measure of enduring attitudes that vary across individuals” (Schimmack, 2021, p. 397). They claim that “the overwhelming theoretical consensus in the community of attitude researchers.
. . is that attitudes emerge from an interaction of persons and situations” (p. 425). It is instructive to compare this surprising claim with Cunningham and Zelazo’s (2007) definition of attitudes as “relatively stable ideas about whether something is good or bad” (p. 97). Kurdi and Banaji (2017) wrote that “differences in implicit attitudes . . . may arise because of multiple components, including relatively stable components [emphasis added]” (p. 286). Rae and Greenwald (2017) stated that it is a “widespread assumption . . . that implicit attitudes are characteristics of people, almost certainly more so than a property of situations” (p. 297).
Greenwald and Lai (2020) stated that test–retest reliability “places an upper limit on correlational tests of construct validity” (p. 425). This statement makes sense only if we assume that the construct to be measured is stable over the retest interval. It is also not clear how it would be ethical to provide individuals with feedback about their IAT scores on the Project Implicit website, if IAT scores were merely a product of the specific situation at the moment they are taking the test. Finally, how can the suicide IAT be a useful predictor of suicide if it cannot not measure some stable dispositions related to suicidal behaviors?

In conclusion, Kurdi et al.’s definition of attitudes is inconsistent with the common definition of attitudes as relatively enduring evaluations. That being said, the more important question is
whether IATs measure stable attitudes or momentary situational effects. Ironically, some of the best evidence comes from Cunningham. Cunningham et al. (2001) repeatedly measured prejudice four times over a 3-month period with multiple measures, including the race IAT. Cunningham et al. (2001) modeled the data with a single trait factor that explained all of the covariation among different measures of racial attitudes. Thus, Cunningham et al. (2001) provided first evidence that most of the valid variance in race IAT scores is perfectly stable over a 3-month period and that person-by-situation interactions had no effect on racial attitudes. There have been few longitudinal studies with IATs since Cunningham et al.’s (2001) seminal study. However, last year, an article examined stability over a 6-year interval (Onyeador et al., 2020). Racial attitudes of more than 3,000 medical students were measured in the first year of medical school, the fourth year of medical school, and the second year of medical residency.
Table 4 shows the correlations for the explicit feeling thermometer and the IAT scores. The first observation is that the Time-1-to-Time-3 correlation for the IAT scores is not smaller than the Time-1-to-Time-2 or the Time-2-to-Time-3 correlations. This pattern shows that a single trait factor can capture the shared variance among the repeated IAT measures. The second observation is that the bold correlations between explicit ratings and IAT scores on the same occasion are only slightly higher than the correlations for different measurement
occasions. This finding shows that there is very little occasion-specific variance in racial attitudes. The third observation is that IAT correlations over time are higher than the corresponding FT-IAT correlations over time. This finding points to IAT-specific method variance that is revealed in studies with multiple implicit measures (Cunningham et al., 2001; Schimmack, 2021). These findings extend Cunningham et al.’s (2001) findings to
a 6-year period and show that most of the valid variance in race IAT scores is stable over long periods of time.

In conclusion, Kurdi et al.’s claims about person-by-situation effects are not supported by evidence.

Conclusion

Like presidential debates, the commentaries and my response present radically different views of reality. In one world, IATs are valid and useful tools that have led to countless new insights into human behavior. In the other world, IATs are noisy measures that add nothing to the information we already get from cheaper self-reports. Readers not well versed in the literature are likely to be confused rather than informed by these conflicting accounts. Although we may expect such vehement disagreement in politics, we should not expect it among scientists.
A common view of scientists is that they are able to resolve disagreement by carefully looking at data and drawing logical conclusions from empirical facts. However, this model of scientists is naive and wrong.

A major source of disagreement among psychologists is that psychology lacks an overarching paradigm; that is, a set of fundamentally shared assumptions and facts. Psychology does not have one paradigm, but many paradigms. The IAT was developed within the implicit social-cognition paradigm that gained influence in the 1990s (Bargh et al., 1996; Greenwald & Banaji, 1995; Nosek et al., 2011). Over the past decade, it has become apparent that the empirical foundations of this paradigm are shaky (Doyen et al., 2012; D. Kahneman quoted in Yong, 2012, Supplemental Material; Schimmack, 2020). It took a long time to see the problems because paradigms are like prisons that make it impossible to see the world from the outside. A key force that prevents researchers within a paradigm from noticing problems is publication bias. Publication bias ensures that studies that are consistent with a paradigm are published, cited, and highlighted in review articles to provide false evidence in support for a paradigm
(Greenwald & Lai, 2020; Kurdi et al., 2021).

Over the past decade, it has become apparent how pervasive these biases have been, especially in social psychology (Schimmack, 2020). The responses to my critique of IATs merely confirms how powerful paradigms and conflicts of interest can be. It is therefore necessary to allocate more resources to validation projects by independent researchers. In addition, validation studies should be preregistered and properly powered, and results need to be published whether they show validity or not. Conducting validation studies of widely used measures could be an important role for the emerging field of meta-psychology that is not focused on new discoveries, but rather on evaluating paradigmatic research from an outsider, meta-perspective (Carlsson et al., 2017). Viewed from this perspective, many IATs that are in use lack credible evidence of construct validity.

References
*References marked with an asterisk report studies included in
the suicide IAT meta-analysis

Banaji, M. R., & Greenwald, A. G. (2013). Blindspot: Hidden
biases of good people. Delacorte Press.

Bargh, J. A., Chen, M., & Burrows, L. (1996). Automaticity
of social behavior: Direct effects of trait construct and
stereotype activation on action. Journal of Personality
and Social Psychology, 71(2), 230–244. https://doi.org/
10.1037/0022-3514.71.2.230

*Barnes, S. M., Bahraini, N. H., Forster, J. E., Stearns-Yoder, K. A.,
Hostetter, T. A., Smith, G., Nagamoto, H. T., & Nock,
M. K. (2017). Moving beyond self-report: Implicit associations
about death/ life prospectively predict suicidal
behavior among veterans. Suicide and Life-Threatening
Behavior, 47, 67–77. https://doi.org/10.1111/sltb.12265

Benjamin, D. J., Berger, J. O., Johannesson, M., Nosek, B. A.,
Wagenmakers, E.-J., Berk, R., Bollen, K. A., Brembs, B.,
Brown, L., Camerer, C., Cesarini, D., Chambers, C. D.,
Clyde, M., Cook, T. D., Boeck, P., De, Dienes, Z., Dreber,
A., Easwaran, K., Efferson, C., . . . Johnson, V. E. (2018).
Redefine statistical significance. Nature Human Behaviour,
2, 6–10.

Bosson, J. K., Swann, W. B. Jr., & Pennebaker, J. W. (2000).
Stalking the perfect measure of implicit self-esteem:
The blind men and the elephant revisited? Journal of
Personality and Social Psychology, 79, 631–643. https://
doi.org/10.1037/0022-3514.79.4.631

Buhrmester, M. D., Blanton, H., & Swann, W. B., Jr. (2011).
Implicit self-esteem: Nature, measurement, and a new way
forward. Journal of Personality and Social Psychology,
100(2), 365–385. https://doi.org/10.1037/a0021341

Carlsson, R., Danielsson, H., Heene, M., Ker, Å., Innes, Lakens,
D., Schimmack, U., Schönbrodt, F. D., van Assen, M., &
Weinstein, Y. Inaugural editorial of Meta-Psychology. Meta-
Psychology, 1. https://doi.org/10.15626/MP2017.1001

Chiurliza, B., Hagan, C. R., Rogers, M. L., Podlogar, M. C., Hom,
M. A., Stanley, I. H., & Joiner, T. E. (2018). Implicit measures
of suicide risk in a military sample. Assessment, 25(5),
667–676. https://doi.org/10.1177/1073191116676363
Cohen, J. (1988). Statistical power analysis for the behavioral
sciences (2nd ed.). Erlbaum.

Cunningham, W. A., Preacher, K. J., & Banaji, M. R. (2001).
Implicit attitude measures: Consistency, stability, and
No Evidence for Construct Validity of IAT 441
convergent validity. Psychological Science, 12(2), 163–170
https://doi.org/10.1111/1467-9280.00328

Cunningham, W. A., & Zelazo, P. D. (2007). Attitudes and
evaluations: A social cognitive neuroscience perspective.
Trends in Cognitive Sciences, 11, 97–104. https://
doi.org/10.1016/j.tics.2006.12.005

Cvencek, D., Meltzoff, A. N., Maddox, C. D., Nosek, B. A.,
Rudman, L. A., Devos, T., Dunham, Y., Baron, A. S.,
Steffens, M. C., Lane, K., Horcajo, J., Ashburn Nardo, L.,
Quinby, A., Srivastava, S. B., Schmidt, K., Aidman, E.,
Tang, E., Farnham, S., Mellott, D. S., . . . Greenwald, A. G.
(2020). Meta-analytic use of balanced identity theory to
validate the Implicit Association Test. Personality and
Social Psychology Bulletin, 47(2), 185–200. https://doi
.org/10.1177/0146167220916631

Doyen, S., Klein, O., Pichon, C. L., & Cleeremans, A. (2012).
Behavioral priming: It’s all in the mind, but whose mind?
PLOS ONE, 7(1), Article e29081. https://doi.org/10.1371/
journal.pone.0029081

Falk, C. F., Heine, S. J., Takemura, K., Zhang, C. X., & Hsu,
C. (2015). Are implicit self-esteem measures valid for
assessing individual and cultural differences. Journal of
Personality, 83, 56–68. https://doi.org/10.1111/jopy.12082

*Glenn, C. R., Millner, A. J., Esposito, E. C., Porter, A. C.,
& Nock, M. K. (2019). Implicit identification with death
predicts suicidal thoughts and behaviors in adolescents.
Journal of Clinical Child & Adolescent Psychology, 48,
263–272. https://doi.org/10.1080/15374416.2018.1528548

Greenwald, A. G., & Banaji, M. R. (1995). Implicit social cognition:
Attitudes, self-esteem, and stereotypes. Psychological
Review, 102(1), 4–27. https://doi.org/10.1037/0033-
295X.102.1.4

Greenwald, A. G., & Farnham, S. D. (2000). Using the Implicit
Association Test to measure self-esteem and self-concept.
Journal of Personality and Social Psychology, 79, 1022–1038
https://doi.org/10.1037/0022-3514.79.6.1022

Greenwald, A. G., & Lai, C. K. (2020). Implicit social cognition.
Annual Review of Psychology, 71, 419–445. https://
doi.org/10.1146/annurev-psych-010419-050837

Greenwald, A. G., McGhee, D. E., & Schwartz, J. L. K. (1998).
Measuring individual differences in implicit cognition:
The Implicit Association Test. Journal of Personality and
Social Psychology, 74, 1464–1480.

*Harrison, D. P., Stritzke, W. G. K., Fay, N., & Hudaib, A.-R.
(2018). Suicide risk assessment: Trust an implicit probe
or listen to the patient? Psychological Assessment, 30(10),
1317–1329. https://doi.org/10.1037/pas0000577

Jiang, C., Vitiello, C., Axt, J. R., Campbell, J. T., & Ratliff, K. A.
(2019). An examination of ingroup preferences among
people with multiple socially stigmatized identities. Self
and Identity. Advance online publication. https://doi.org/
10.1080/15298868.2019.1657937

Kurdi, B., & Banaji, M. R. (2017). Reports of the death of
the individual difference approach to implicit social cognition
may be greatly exaggerated: A commentary on Payne,
Vuletich, and Lundberg. Psychological Inquiry, 28,
281–287. https://doi.org/10.1080/1047840X.2017.1373555

Kurdi, B., Ratliff, K. A., & Cunningham, W. A. (2021). Can
the Implicit Association Test serve as a valid measure of
automatic cognition? A response to Schimmack (2021).
Perspectives on Psychological Science, 16(2), 422–434.
https://doi.org/10.1177/1745691620904080

Kurdi, B., Seitchik, A. E., Axt, J. R., Carroll, T. J., Karapetyan,
A., Kaushik, N., Tomezsko, D., Greenwald, A. G., &
Banaji, M. R. (2019). Relationship between the Implicit
Association Test and intergroup behavior: A meta-analysis.
American Psychologist, 74(5), 569–586. https://doi.org/
10.1037/amp0000364

*Millner, A. J., Augenstein, T. M., Visser, K. H., Gallagher, K.,
Vergara, G. A., D’Angelo, E. J., & Nock, M. K. (2019). Implicit
cognitions as a behavioral marker of suicide attempts in
adolescents. Archives of Suicide Research, 23(1), 47–63.
https://doi.org/10.1080/13811118.2017.1421488

*Nock, M. K., & Banaji, M. R. (2007). Prediction of suicide ideation
and attempts among adolescents using a brief performance-
based test. Journal of Consulting and Clinical
Psychology, 75(5), 707–715. https://doi.org/10.1037/0022-
006X.75.5.707

*Nock, M. K., Park, J. M., Finn, C. T., Deliberto, T. L.,
Dour, H. J., & Banaji, M. R. (2010). Measuring the suicidal
mind: Implicit cognition predicts suicidal behavior.
Psychological Science, 21(4), 511–517. https://doi
.org/10.1177/0956797610364762

Nosek, B. A., & Bar-Anan, Y. (2012). Scientific utopia: I. Opening
scientific communication. Psychological Inquiry, 23(3),
217–243. https://doi.org/10.1080/1047840X.2012.692215

Nosek, B. A., Hawkins, C. B., & Frazier, R. S. (2011). Implicit
social cognition: From measures to mechanisms. Trends
in Cognitive Sciences, 15(4), 152–159. https://doi.org/
10.1016/j.tics.2011.01.005

Onyeador, I. N., Wittlin, N. M., Burke, S. E., Dovidio, J. F.,
Perry, S. P., Hardeman, R. R., Dyrbye, L. N., Herrin, J.,
Phelan, S. M., & van Ryn, M. (2020). The value of interracial
contact for reducing anti-Black bias among non-Black
physicians: A Cognitive Habits and Growth Evaluation
(CHANGE) study report. Psychological Science, 31(1),
18–30. https://doi.org/10.1177/0956797619879139

Phelps, E. A., Cannistraci, C. J., & Cunningham, W. A. (2003).
Intact performance on an indirect measure of race bias
following amygdala damage. Neuropsychologia, 41(2),
203–208. https://doi.org/10.1016/s0028-3932(02)00150-1

Rae, J. R., & Greenwald, A. G. (2017). Persons or situations?
Individual differences explain variance in aggregated
implicit race attitudes. Psychological Inquiry, 28, 297–300.
https://doi.org/10.1080/1047840X.2017.1373548

*Randall, J. R., Rowe, B. H., Dong, K. A., Nock, M. K., &
Colman, I. (2013). Assessment of self-harm risk using
implicit thoughts. Psychological Assessment, 25(3), 714–721
https://doi.org/10.1037/a0032391

Schimmack, U. (2012). The ironic effect of significant results
on the credibility of multiple-study articles. Psychological
Methods, 17(4), 551–566. https://doi.org/10.1037/a0029487

Schimmack, U. (2020). A meta-psychological perspective on
the decade of replication failures in social psychology.
Canadian Psychology/Psychologie canadienne, 61(4),
364–376. http://doi.org/10.1037/cap0000246

Schimmack, U. (2021). The Implicit Association Test: A method
in search of a construct. Perspectives on Psychological Science, 16(2), 396–414. https://doi.org/10.1177/1745691619863798

Teachman, B. A., Clerkin, E. M., Cunningham, W. A., Dreyer-
Oren, S., & Werntz, A. (2019). Implicit cognition and
psychopathology: Looking back and looking forward.
Annual Review of Clinical Psychology, 15, 123–148.
https://doi.org/10.1146/annurev-clinpsy-050718-095718

*Tello, N., Harika-Germaneau, G., Serra, W., Jaafari, N., &
Chatard, A. (2020). Forecasting a fatal decision: Direct
replication of the predictive validity of the Suicide–
Implicit Association Test. Psychological Science, 31(1),
65–74. https://doi.org/10.1177/0956797619893062

Vianello, M., & Bar-Anan, Y. (2021). Can the Implicit Association
Test measure automatic judgment? The validation continues.
Perspectives on Psychological Science, 16(2), 415–421.
https://doi.org/10.1177/1745691619897960

Vul, E., Harris, C., Winkielman, P., & Pashler, H. (2009).
Puzzlingly high correlations in fMRI studies of emotion,
personality, and social cognition. Perspectives on
Psychological Science, 4(3), 274–290. https://doi.org/10
.1111/j.1745-6924.2009.01125.x

Walker, S. S., & Schimmack, U. (2008). Validity of a happiness
implicit association test as a measure of subjective wellbeing.
Journal of Research in Personality, 42, 490–497.
https://doi.org/10.1016/j.jrp.2007.07.005

Yong, E. (2012 October 12). Nobel laureate challenges
psychologists to clean up their act. Nature. https://doi
.org/10.1038/nature.2012.11535

Psychologists are not immune to the Dunning-Kruger Effect

Background

Bar-Anan and Vianello (2018) published a structural equation model in support of a dual-attitude model that postulates explicit and implicit attitudes towards racial groups, political parties, and the self. I used their data to argue against a dual-attitude model. Vianello and Bar-Anan (2020) wrote a commentary that challenged my conclusions. I was a reviewer of their commentary and pointed out several problems with their new model (Schimmack, 2020). They did not respond to my review and their commentary was published without changes. I wrote a reply to their commentary. In the reply, I merely pointed to my criticism of their new model. Vianello and Bar-Anan wrote a review of my reply, in which they continue to claim that my model is wrong. I invited them to discuss the differences between our models, but they declined. In this blog post, I show that Vianello and Bar-Anan lack insight into the shortcomings of their model, which is consistent with the Dunning-Kruger effect that incompetent individuals lack insight into their own incompetence. On top of this, Vianello and Bar-Anan show willful ignorance by resisting arguments that undermine their motivated belief in dual-attitude models. As I show below, Vianello and Bar-Anan’s model has several unexplained results (e.g, negative loadings on method factors), worse fit than my model, and produces false evidence of incremental predictive validity for the implicit attitude factors.

Introduction

The skill set of psychology researchers is fairly limited. In some areas expertise is needed to create creative experimental setups. In other areas, some expertise in the use of measurement instruments (e.g., EEG) is required. However, for the most part, once data are collected, little expertise is needed. Data are analyzed with simple statistical tools like t-tests, ANOVAs, or multiple regression. These statistical methods are implemented in simple commands and no expertise is required to obtain results from statistics programs like SPSS or R.

Structural equation modeling is different because researchers have to specify a model that is fitted to the data. With complex data sets, the number of possible models that can be specified increases exponentially and it is not possible to specify all models and to simply pick the model with the best fit. Moreover, there will be many models with similar fit and it requires expertise to pick plausible models. Unfortunately, psychologists receive little formal training in structural equation modeling because graduate training relies heavily on training by supervisors rather than formal training. As most supervisors never received training in structural equation modeling, they cannot teach their graduate student how to perform these analyses. This means that expertise in structural equation modeling varies widely.

An inevitable consequence of wide variation in expertise is that individuals with low expertise have little insight into their limited abilities. This is known as the Dunning-Kruger effect that has been replicated in numerous studies. Even incentives to provide accurate performance estimates do not eliminate the overconfidence of individuals with low levels of expertise (Ehrlinger et al., 2008).

The Dunning-Kruger effect explains Vianello and Bar-Anan’s (2020) response to my article that presents another ill-fitting model that makes little theoretical sense. This overconfidence may also explain why they are unwilling to engage in a discussion of their model with me. They may not realize that my model is superior because they were unable to compare the models or to run more direct comparisons of the models. As their commentary is published in the influential journal Perspectives on Psychological Science and as many readers lack the expertise to evaluate the merits of their criticism, it is necessary to explain clearly why their criticism of my models is invalid and why their new alternative model is flawed.

Reproducing Vianello and Bar-Anan’s Model

I learned the hard way that the best way to fit a structural equation model is to start with small models of parts of the data and then to add variables or other partial models to build a complex model. The reason is that bad fit in smaller models can be easily identified and lead to important model modifications, whereas bad fit in a complex model can have thousands of reasons that are difficult to diagnose. In this particular case, I saw new reason to even fit a complex model for attitudes to political parties, racial groups, and the self. Instead I fitted separate models for each attitude domain. Vianello and Bar-Anan (2020) take issue with this decision.

As for estimating method variance across attitude domains, that is the very logic behind an MTMM design (Campbell & Fiske, 1959; Widaman, 1985): Method variance is shared across measures of different traits that use the same method (e.g., among indirect measures
of automatic racial bias and political preferences). Trait variance is shared across measures of the same trait that use different methods (e.g., among direct and indirect measures of racial attitude). Separating the MTMM matrix into three separate submatrices (one for each
trait), as Schimmack did in his article, misses a main advantage of an MTMM design.

This criticism is based on an outdated notion of validation by means of correlations in a multi-trait-multi-method matrix. In this MTMM tables, every trait is measured with all methods. For example, the Big Five traits are measured with students’ self-ratings, mothers’ ratings, and fathers’ ratings (5 traits x 3 methods). This is not possible for validation studies of explicit and implicit measures because it is assumed that explicit measures measure explicit constructs and implicit measures measure implicit constructs. Thus, it is not possible to fully cross traits and methods. This problem is evident in all models by Bar-Anan and Vianello and myself. Bar-Anan and Vianello make the mistake to assume that using implicit measures for several attitude domains solves this problem, but their assumption that we can use correlations between implicit measures in one domain and implicit measures in another domain to solve this problem is wrong. In fact, it makes matters worse because they fail to model method variance within a single attitude domain properly.

To show this problem, I first constructed measurement models for each attitude domain and then show that combining well-fitting models of three three domains produces a better fitting model than Vianello and Bar-Anan’s model.

Racial Bias

In their revised model, Vianello and Bar-Anan postulate three method factors. One for explicit measures, one for IAT-related measures, and one for the Affective Missatribution Paradigm and the Evaluative Priming Task. It is not possible to estimate a separate method factor for all explicit measures, but it is possible to allow for method factors that are unique to the IAT-related measures and one that is unique to the AMP and EPT. In the first model, I fitted this model to the measures of racial bias. The model appears to have good fit, RMSEA = .013, CFI = 973. In this model, the correlation between the explicit and implicit racial bias factors is r = .80.

However, it would be premature to stop the analysis here because overall fit values in models with many missing values are misleading (Zhang & Savaley, 2019). Even if fit were good, it is good practice to examine the modification indices to see whether some parameters are misspecified.

Inspection of the fit indices shows one very large Modification Index of 146.04 for the residual correlation between the feeling thermometer and the preference ratings. There is a very plausible explanation for this finding. These two measures are very similar and can share method variance. For example, social desirable responding could have the same effect on both ratings. This was the reason why I included only one of the two measures in my model. An alternative is to include both ratings and allow for the correlated residual to model shared method variance.

As predicted by the MI, model fit improved, RMSEA = .006, CFI = .995. Vianello and Bar-Anan (2020) might object that this finding is post-hoc after peeking at the data, while their model is specified theoretically. However, this argument is weak. If they really theoretically predicted that feeling thermometer and direct ratings share no method variance, it is not clear what theory they have in mind. After all, shared rating biases are very common. Moreover, their model also assumes shared method variance between these factors, but it also predicts that this method variance also influences dissimilar measures like the Modern Racism Scale and even ratings of other attitude objects. In short, neither their model nor my models are based on theories, in part because psychologists have ignored to develop and validate measurement theories. Even if it were theoretically predicted that feeling-thermometer and preference ratings do not share method variance, the large MI for this parameter would indicate that this theory is wrong. Thus, the data falsify this prediction. In the modified model, the implicit-explicit correlation increases from .80 to .90, providing even less support for the dual-attitude model.

Further inspection of the MI showed no plausible further improvements of the model. One important finding in this partial model is that there is no evidence of shared method variance between the AMP and EPT, r = -.04. Thus, closer inspection of the correlations among the racial attitude domain suggests two problems for Vianello and Bar-Anan’s model. There is evidence of shared method variance between two explicit measures and there is no evidence of shared method variance between two implicit measures, namely the AMP and EPT.

Next, I built a model for the political orientation domain starting with the specification in Vianello and Bar-Anan’s model. Once more, overall fit appears to be good, RMSEA = .014, CFI = .989. In this model, the correlation between the implicit and explicit factor is r = .9. However, inspection of the MI replicates a residual correlation between feeling thermometer and preference ratings. MI = 91.91. Allowing for this shared method variance improved model fit, RMSEA = .012, CFI = .993, but had little effect on the implicit-explicit correlation, r = .91. In this model, there was some evidence of shared method variance between the AMP and EPT, r = .13.

Next, I put these two well-fitting models together, leaving each model unchanged. The only new question is how measures of racial bias should be related to measures of political orientation. It is common to allow trait factors to correlate freely. This is also what Vianello and Bar-Anan did and I followed this common practices. Thus, there is no theoretical structure imposed on the trait correlations. I did not specify any additional relations for the method factors. If such relationships exist, this should lead to low fit. Model fit seemed to be good, RMSEA = .009, CFI = .982. The biggest MI was observed for the loading of the Modern Racism Scale (MRS) on the explicit political orientation factor, MI = 197.69. This is consistent with the item content of the MRS that combines racism with conservative politics (e.g., being against affirmative action). For that reason, I included the MRS in my measurement model of political orientation (Schimmack, 2020).

Vianello and Bar-Anan (2020) criticize my use of the MRS. “For instance, Schimmack chose to omit one of the indirect measures—the SPF—from the models, to include the Modern Racism Scale (McConahay, 1983) as an indicator of political evaluation, and to omit the thermometer scales from two of his models. We assume that Schimmack had good practical or theoretical reasons for his modelling decisions; unfortunately, however, he did not include those reasons.” If they had inspected the MI, they would have seen that my decision to use the MRS as a different method to measure political orientation was justified by the data as well as by the item-content of the scale.

After allowing for this theoretically expected relationship, model fit improves, chi2(df = 231) = 506.93, RMSEA = .007, CFI = .990. Next I examined whether the IAT method factor for racial bias is related to the IAT method factor for political orientation. Adding this relationship did not improve fit, chi2(230) = 506.65 = RMSEA = .007, CFI = .990. More important, the correlation was not significant, r = -.06. This is a problem for Vianello and Bar-Anan’s model that assumes the two method factors are identical. To test this hypothesis, I fitted a model with a single IAT method factor. This model had worse fit, chi2(231) = 526.99, RMSEA = .007, CFI = .989. Thus, there is no evidence for a general IAT method factor.

I next explored the possibility of a method factor for the explicit measures. I had identified shared method variance for the feeling thermometer and preference ratings for racial bias and for political orientation. I now modeled this shared method variance with method factors and let the two method factors correlate with each other. The addition of a correlation did not improve model fit, chi2(230) = 506.93, RMSEA = .007, CFI = .990 and the correlation between the two explicit method factors was not significant, r = .00. Imposing a single method factor for both attitude domains reduced model fit, chi2(df = 229) = 568.27, RMSEA = .008, CFI = .987.

I also tried to fit a single method factor for the AMP and EPT. The model only converged by constraining two loadings. Then model fit improved slightly, chi2(df = 230) = 501.75, RMSEA = .007, CFI = .990. The problem for Vianello and Bar-Anan is that the better fit was achieved with a negative loading on the method factor. This is inconsistent with the idea that a general method factor inflates correlations across attitude domains.

In sum, there is no evidence that method factors are consistent across the two attitude domains. Therefore I retained the basic model that specified method variance within attitude domains. I then added the three criterion variables to the model. As in Vianello and Bar-Anan’s model, contact was regressed on the explicit and implicit racial bias factor and previous voting and intention to vote were regressed on the explicit and implicit political orientation factors. The residuals were allowed to correlate freely, as in Vianello and Bar-Anan’s model.

Overall model fit decreased slightly for CFI, chi2(df = 297) = 668.61, RMSEA = .007, CFI = .988. MI suggested an additional relationship between the explicit political orientation factor and racial contact. Modifying the model accordingly improved fit slightly, chi2(df = 296) = 660.59, RMSEA = .007, CFI = .988. There were no additional MI involving the two voting measures.

Results were different from Vianello and Bar-Anan’s results. They reported that the implicit factors had incremental predictive validity for all three criterion measures.

In contrast, the model I am developing here shows no incremental predictive validity for the implicit factors.

It is important to note that I create the measurement model before I examined predictive validity. After the measurement model was created, criterion variables were added and the data determined the pattern of results. It is unclear how Vianello and Bar-Anan developed a measurement model with non-existing method factors that produced the desired outcome of significant incremental validity.

To try to reproduce their full result, I also added self-esteem measures to the model. To do so, I first created a measurement model for the self-esteem measures. The basic measurement model had poor fit, chi2(df = 58) = 434.49, RMSEA = .019, CFI = .885. Once more, the MI suggested that feeling-thermometer and preference ratings shared method variance. Allowing for this residual correlation increased model fit, chi2(df = 57) = 165.77, RMSEA = .010, CFI = .967. Another MI suggested a loading of the speeded task on the implicit factor, MI = 54.59. Allowing for this loading further improved model fit, chi2(df = 56) = 110.01, RMSEA = .007, CFI = .983. The crucial correlation between the explicit and implicit factor was r = .36. The correlation in Vianello and Bar-Anan’s model was r = .30.

I then added the self-esteem model to the model with the other two attitude domains, chi2(df = 695) = 1309.59, RMSEA = .006, CFI = .982. Next I added correlations of the IAT method factor for self-esteem with the two other IAT-method factors. This improved model fit, chi2(df = 693) = 1274.59, RMSEA = .006, CFI = .983. The reason was a significant correlation between the IAT method factors for self-esteem and racial bias. I offered an explanation for this finding in my article. Most White respondents associate self with good and White with good. If some respondents are better able to control their automatic tendencies, they will show less pro-self and pro-White biases. In contrast, Vianello and Bar-Anan have no theoretical explanation for a shared method factor across attitude domains. There was no significant correlation between IAT method factors for self-esteem and political orientation. The reason is that political orientation has more balanced automatic tendencies so that method variance does not favor one direction over the other.

This model had better fit with fewer parameters than Vianello and Bar-Anan’s model, chi2(df = 679) = 1719.39, RMSEA = .008, CFI = .970. The critical results of predictive validity remained unchanged.

I also fitted Vianello and Bar-Anan’s model and added four parameters that I identified as missing from their model: (a) the loading of the MRS on the explicit political orientation factor and (b) the correlations between feeling-thermometer and preference ratings for each domain. Making these adjustments improved model fit considerably, chi2(df = 675) = 1235.59, RMSEA = .006, CFI = .984. This modest adjustment altered the pattern of results for the prediction of the three criterion variables. Unlike Vianello and Bar-Anan’s model, the implicit factors no longer predicted any of the three criterion variables.

Conclusion

My interaction with Vianello and Bar-Anan are symptomatic of social psychologists misapplication of the scientific method. Rather than using data to test theories, data are being abused to confirm pre-existing beliefs. This confirmation bias goes against philosophies of science that have demonstrated the need to subject theories to strong tests and to allow data to falsify theories. Verificationism is so ingrained in social psychology that Vianello and Bar-Anan ended up with a model that showed significant incremental predictive validity for all three criterion measures in their model, when this model made several questionable assumptions. They may object that I am biased in the opposite direction, but I presented clear justifications for modeling decisions and my model fits better than their model. In my 2020 article, I showed that Bar-Anan also co-authored another article that exaggerated evidence of predictive validity that disappeared when I reanalyzed the data (Greenwald, Smith, Sriram, Bar-Anan, & Nosek, 2009). Ten years later, social psychologists claim that they have improved their research methods, but Vianello and Bar-Anan’s commentary in 2020 shows that social psychologists have a long way to go. If social psychologists want to (re)gain trust, they need to be willing to discard cherished theories that are not supported by data.

References

Bar-Anan, Y., & Vianello, M. (2018). A multi-method multi-trait test of the dual-attitude perspective. Journal of Experimental Psychology: General, 147(8), 1264–1272. https://doi.org/10.1037/xge0000383

Ehrlinger, J., Johnson, K., Banner, M., Dunning, D., & Kruger, J. (2008). Why the unskilled are unaware: Further explorations of (absent) self-insight among the incompetent. Organizational Behavior and Human Decision Processes, 105(1), 98–121. https://doi.org/10.1016/j.obhdp.2007.05.002

Greenwald, A. G., Smith, C. T., Sriram, N., Bar-Anan, Y., & Nosek, B. A. (2009). Implicit race attitudes predicted vote in the 2008 U.S. Presidential election. Analyses of Social Issues and Public Policy (ASAP), 9(1), 241–253. https://doi.org/10.1111/j.1530-2415.2009.01195.x

Schimmack U. The Implicit Association Test: A Method in Search of a Construct. Perspectives on Psychological Science. October 2019. doi:10.1177/1745691619863798

Vianello M, Bar-Anan Y. Can the Implicit Association Test Measure Automatic Judgment? The Validation Continues. Perspectives on Psychological Science. February 2020. doi:10.1177/1745691619897960

Zhang, X. & Savalei, V. (2020) Examining the effect of missing data on RMSEA and CFI under normal theory full-information maximum likelihood, Structural Equation Modeling: A Multidisciplinary Journal, 27:2, 219-239, DOI: 10.1080/10705511.2019.1642111

Racial Bias as a Trait

Prejudice is an important topic in psychology that can be examined from various perspectives. Nevertheless, prejudice research is typically studied by social psychologists. As a result, research has focused on social cognitive processes that are activated in response to racial stimuli (e.g., pictures of African Americans) and experimental manipulations of the situation (e.g., race of experimenter). Other research has focused on cognitive processes that can lead to the formation of racial bias (e.g., the minimal group paradigm). Sometimes this work has been based on a model of prejudice that assumes racial bias is a common attribute of all people (Devine, 1989) and that individuals only differ in their willingness or ability to act on their racial biases.

An alternative view is that racial biases vary across individuals and are shaped by experiences with out-group members. The most prominent theory is contact theory, which postulates that contact with out-group members reduces racial bias. In social psychology, individual differences in racial biases are typically called attitudes, where attitudes are broad dispositions to respond to a class of attitude objects in a consistent manner. For example, individuals with positive attitudes towards African Americans are more likely to have positive thoughts, feelings, and behaviors in interactions with African Americans.

The notion of attitudes as general dispositions shows that attitudes play the same role in social psychology that traits play in personality psychology. For example, extraversion is a general disposition to have more positive thoughts, feelings, and to engage more in social interactions. One important research question in personality psychology are the causes of variation in personality. Why are some people more extraverted than others? A related question is how stable personality traits are. If the causes of extraversion are environmental factors, extraversion should change when the environment changes. If the causes of extraversion are within the person (e.g., early childhood experiences, genetic differences), extraversion should be stable. Thus, the stability of personality traits over time is an empirical question that can only be answered in longitudinal studies that measure personality traits repeatedly. A meta-analysis shows that the Big Five personality traits are highly stable over time (Anusic & Schimmack, 2016).

In comparison, the stability of attitudes has received relatively little attention in social psychology because stable individual differences are often neglected in social cognitive models of attitudes. This is unfortunate because the origins of racial bias are important to the understanding of racial bias and to design interventions that help individuals to reduce their racial biases.

How stable are racial biases?

The lack of data has not stopped social psychologists from speculating about the stability of racial biases. “It’s not as malleable as mood and not as reliable as a personality trait. It’s in between the two–a blend of both a trait and a state characteristic” (Nosek in Azar, 2008). In 2019, Nosek was less certain about the stability of racial biases. “One is does that mean we have have some degree of trait variance because there is some stability over time and what is the rest? Is the rest error or is it state variance in some way, right. Some variation that is meaningful variation that is sensitive to the context of measurement. Surely it is some of both, but we don’t know how much” (The Psychology Podcast, 2019).

Other social psychologists have made stronger claims about the stability of racial bias. Payne argued that racial bias is a state because implicit bias measures show higher internal consistency than retest correlations (Payne, 2017). However, the comparison of internal consistency and retest correlations is problematic because situational factors may simply produce situation-specific measurement errors rather than reflecting real changes in the underlying trait; a problem that is well recognized in personality psychology. To examine this question more thoroughly, it is necessary to obtain multiple retests and decompose the variances into trait, state, and error variances (Anusic & Schimmack, 2016). Even this approach cannot distinguish between state variance and systematic measurement error, which requires multi-method data (Schimmack, 2019).

A Longitudinal Multi-Method Study of Racial Bias

A recent article reported the results of an impressive longitudinal study of racial bias with over 3,000 medical students who completed measures of racial bias and inter-group contact three times over a period of six year (first year of medical school, fourth year of medical school, 2nd year of residency) (Onyeador et al., 2019). I used the openly shared data to fit a multi-method state-trait-error model to the data (https://osf.io/78cqx/).

The model integrates several theoretical assumptions that are consistent with previous research (Schimmack, 2019). First, the model assumes that explicit ratings of racial bias (feeling thermometer) and implicit measures of racial bias (Implicit Association Test) are complementary measures of individual differences in racial bias. Second, the model assumes that one source of variance in racial bias is a stable trait. Third, the model assumes that racial bias differs across racial groups, in that Black individuals have more favorable attitudes towards Black people than members from other groups. Fourth, the model assumes that contact is negatively correlated with racial bias without making a strong causal assumption about the direction of this relationship. The model also assumes that Black individuals have more contact with Black individuals and that contact partially explains why Black individuals have less racial biases.

The new hypotheses that could be explored with these data concerned the presence of state variance in racial bias. First, state variance should produce correlations between the occasion specific variances of the two methods. That is, after statistically removing trait variance, residual state variance in feeling thermometer scores should be correlated with residual variances in IAT scores. For example, as medical students interact more with Black staff and patients in residency, their racial biases could change and this would produce changes in explicit ratings and in IAT scores. Second, state variance is expected to be somewhat stable over shorter time intervals because environments tend to be stable over shorter time intervals.

The model in Figure 1 met standard criteria of model fit, CFI = .997, RMSEA = .016.

Describing the model from left to right, race (0 = Black, 1 = White) has the expected relationship with quantity of contact (quant1) in year 1 (reflecting everyday interactions with Black individuals) and with the racial bias (att) factor. In addition, more contact is related to less pro-White bias (-.28). The attitude factor is a stronger predictor of the explicit trait factor (.78; ft; White feeling-thermometer – Black feeling-thermometer) than on the implicit trait factor (.60, iat). The influence of the explicit trait factor on measures on the three occasions (.58-.63) suggests that about one-third of the variance in these measures is trait variance. The same is true for individual IATs (.59-.62). The effect of the attitude factor on individual IATs (.60 * .60 = .36; .36^2 = .13 suggests that less than 20% of the variance in an individual IAT reflects racial bias. This estimate is consistent with the results from multi-method studies (Schimmack, 2019). However, these results suggests that the amount of valid trait variance can increase up to 36%, by aggregating scores of several IATs. In sum, these results provide first evidence that racial bias is stable over a period of six years and that both explicit ratings and implicit ratings capture trait variance in racial bias.

Turning to the bottom part of the model, there is weak evidence to suggest that residual variances (that are not trait variance) in explicit and implicit ratings are correlated. Although the correlation of r = .06 at time 1 is statistically significant, the correlations at time 2 (r = .03) and time 3 (r = .00) are not. This finding suggests that most of the residual variance is method specific measurement error rather than state-variance in racial bias. There is some evidence that the explicit ratings capture more than occasion-specific measurement error because state variance at time 1 predicts state variance at time 2 (r = .25) and from time 2 to time 3 (r = .20). This is not the case for the IAT scores. Finally, contact with Black medical staff at time 2 is a weak, but significant predictor of explicit measures of racial bias at time 2 and time 3, but it does not predict IAT scores at time 2 and 3. These findings do not support the hypothesis that changes in racial bias measures reflect real changes in racial biases.

The results are consistent with the only other multi-method longitudinal study of racial bias that covered only a brief period of three months. In this study, even implicit measures showed no convergent validity for the state (non-trait) variance on the same occasion (Cunningham, Preacher, & Banaji, 1995).

Conclusion

Examining predictors of individual differences in racial bias is important to understand the origins of racial biases and to develop interventions that help individuals to reduce their racial biases. Examining the stability of racial bias in longitudinal studies shows that these biases are stable dispositions and there is little evidence that they change with changing life-experiences. One explanation is that only close contact may be able to shift attitudes and that few people have close relationships with outgroup members. Thus stable environments may contribute to stability in racial bias.

Given the trait-like nature of racial bias, interventions that target attitudes and general dispositions may be relatively ineffective, as Onyeador et al.’s (2019) article suggested. Thus, it may be more effective to target and assess actual behaviors in diversity training. Expecting diversity training to change general dispositions may be misguided and lead to false conclusions about the effectiveness of diversity training programs.

Anti-Black Bias on the IAT predicts Pro-Black Bias in Behavior

Over 20 years ago, Anthony Greenwald and colleagues introduced the Implicit Association Test (IAT) as a measure of individual differences in implicit bias (Greenwald et al., 1998). The assumption underlying the IAT is that individuals can harbour unconscious, automatic, hidden, or implicit racial biases. These implicit biases are distinct from explicit bias. Somebody could be consciously unbiased, while their unconscious is prejudice. Theoretically, the opposite would also be possible, but taking IAT scores at face value, the unconscious is more prejudice than conscious reports of attitudes imply. It is also assumed that these implicit attitudes can influence behavior in ways that bypass conscious control of behavior. As a result, implicit bias in attitudes leads to implicit bias in behavior.

The problem with this simple model of implicit bias is that it lacks scientific support. In a recent review of validation studies, I found no scientific evidence that the IAT measures hidden or implicit biases outside of people’s awareness (Schimmack, 2019a). Rather, it seems to be a messy measure of consciously accessible attitudes.

Another contentious issue is the predictive validity of IAT scores. It is commonly implied that IAT scores predict bias in actual behavior. This prediction is so straightforward that the IAT is routinely used in implicit bias training (e.g., at my university) with the assumption that individuals who show bias on the IAT are likely to show anti-Black bias in actual behavior.

Even though the link between IAT scores and actual behavior is crucial for the use of the IAT in implicit bias training, this important question has been examined in relatively few studies and many of these studies had serious methodological limitations (Schimmack, 20199b).

To make things even more confusing, a couple of papers even suggested that White individuals’ unconscious is not always biased against Black people: “An unintentional, robust, and replicable Pro-Black bias in social judgment (Axt, Ebersole, & Nosek, 2016; Axt, 2017).

I used the open data of these two articles to examine more closely the relationship between scores on the attitude measures (the Brief Implicit Association Test & a direct explicit rating on a 7-point scale) and performance on a task where participants had to accept or reject 60 applicants into an academic honor society. Along with pictures of applicants, participants were provided with information about academic performance. These data were analyzed with signal-detection theory to obtain a measure of bias. Pro-White bias would be reflected in a lower admission standard for White applicants than for Black applicants. However, despite pro-White attitudes, participants showed a pro-Black bias in their admissions to the honor society.

Figure 1 shows the results for the Brief IAT. The blue lines show are the coordinates with 0 scores (no bias) on both tasks. The decreasing red line shows the linear relationship between BIAT scores on the x-axis and bias in admission decisions on the y-axis. The decreasing trend shows that, as expected, respondents with more pro-White bias on the BIAT are less likely to accept Black applicants. However, the picture also shows that participants with no bias on the BIAT have a bias to select more Black than White applicants. Most important, the vertical red line shows behavior of participants with the average performance on the BIAT. Even though these participants are considered to have a moderate pro-White bias, they show a pro-Black bias in their acceptance rates. Thus, there is no evidence that IAT scores are a predictor of discriminatory behavior. In fact, even the most extreme IAT scores fail to identify participants who discriminate against Black applicants.

A similar picture emerges for the explicit ratings of racial attitudes.

The next analysis examine convergent and predictive validity of the BIAT in a latent variable model (Schimmack, 2019). In this model, the BIAT and the explicit measure are treated as complementary measures of a single attitude for two reasons. First, multi-method studies fail to show that the IAT and explicit measures tap different attitudes (Schimmack, 2019a). Second, it is impossible to model systematic method variance in the BIAT in studies that use only a single implicit measure of attitudes.

The model also includes a group variable that distinguishes the convenience samples in Axt et al.’s studies (2016) and the sample of educators in Axt (2017). The grouping variable is coded with 1 for educators and 0 for the comparison samples.

The model meets standard criteria of model fit, CFI = .996, RMSEA = .002.

Figure 3 shows the y-standardized results so that relationships with the group variable can be interpreted as Cohen’s d effect sizes. The results show a notable difference (d = -59) in attitudes between the two samples with less pro-White attitudes for educators. In addition, educators have a small bias to favor Black applicants in their acceptance decisions (d = .19).

The model also shows that racial attitudes influence acceptance decisions with a moderate effect size, r = -.398. Finally, the model shows that the BIAT and the single-item explicit rating have modest validity as measures of racial attitudes, r = .392, .429, respectively. The results for the BIAT are consistent with other estimates that a single IAT has no more than 20% (.392^2 = 15%) valid variance. Thus, the results here are entirely consistent with the view that explicit and implicit measures tap a single attitude and that there is no need to postulate hidden, unconscious attitudes that can have an independent influence on behavior.

Based on their results, Axt et al. (2016) caution readers that the relationship between attitudes and behaviors is more complex than the common narrative of implicit bias assumes.

The authors “suggest that the prevailing emphasis on pro-White biases in judgment and behavior in the existing literature would improve by refining the theoretical understanding of under what conditions behavior favoring dominant or minority groups will occur.” (p. 33).

Implications

For two decades, the developers of the IAT have argued that the IAT measures a distinct type of attitudes that reside in individuals’ unconscious and can influence behavior in ways that bypass conscious control. As a result, even individuals who aim to be unbiased might exhibit prejudice in their behavior. Moreover, the finding that the majority of White people show a pro-White bias in their IAT scores was used to explain why discrimination and prejudice persist. This narrative is at the core of implicit bias training.

The problem with this story is that it is not supported by scientific evidence. First, there is no evidence that IAT scores reflect some form of unconscious or implicit bias. Rather, IAT scores seem to tap the same cognitive and affective processes that influence explicit ratings. Second, there is no evidence that processes that influence IAT scores can bypass conscious control of behavior. Third, there is no evidence that a pro-White bias in attitudes automatically produces a pro-White bias in actual behaviors. Not even Freud assumed that unconscious processes would have this effect on behavior. In fact, he postulated that various defense mechanisms may prevent individuals from acting on their undesirable impulses. Thus, the prediction that attitudes are sufficient to predict behavior is too simplistic.

Axt et al. (2016= speculate that “bias correction can occur automatically and without awareness” (p. 32). While this is an intriguing hypothesis, there is little evidence for such smart automatic control processes. This model also implies that it is impossible to predict actual behaviors from attitudes because correction processes can alter the influence of attitudes on behavior. This implies that only studies of actual behavior can reveal the ability of IAT scores to predict actual behavior. For example, only studies of actual behavior can demonstrate whether police officers with pro-White IAT scores show racial bias in the use of force. The problem is that 20 years of IAT research have uncovered no robust evidence that IAT scores actually predict important real-world behaviors (Schimmack, 2019b).

In conclusion, the results of Axt’s studies suggest that the use of the IAT in implicit bias training needs to be reconsidered. Not only are test scores highly variable and often provide false information about individuals’ attitudes; they also do not predict actual behavior of discrimination. It is wrong to assume that individuals who show a pro-White bias on the IAT are bound to act on these attitudes and discriminate against Black people or other minorities. Therefore, the focus on attitudes in implicit bias training may be misguided. It may be more productive to focus on factors that do influence actual behaviors and to provide individuals with clear guidelines that help them to act in accordance with these norms. The belief that this is not sufficient is based on an unsupported model of unconscious forces that can bypass awareness.

This conclusion is not totally new. In 2008, Blanton criticized the use of the IAT in applied settings (IAT: Fad or fabulous?)

“There’s not a single study showing that above and below that cutoff people differ in any way based on that score,” says Blanton.

And Brian Nosek agreed.

Guilty as charged, says the University of Virginia’s Brian Nosek, PhD, an IAT developer.

However, this admission of guilt has not changed behavior. Nosek and other IAT proponents continue to support Project Implicit that provided millions of visitors with false information about their attitudes or mental health issues based on a test with poor psychometric properties. A true admission of guilt would be to stop this unscientific and unethical practice.

References

Axt, J.R. (2017). An unintentional pro-Black bias in judgement among educators. British Journal of Educational Psychology, 87, 408-421.

Axt, J.R., Ebersole, C.R. & Nosek, B.A. (2016). An unintentional, robust, and replicable pro-Black bias in social judgment. Social Cognition34, 1-39.

Greenwald, A. G., McGhee, D. E., & Schwartz, J. L. K. (1998). Measuring individual differences in implicit cognition: The Implicit Association Test. Journal of Personality and Social Psychology, 74, 1464–1480.

Schimmack, U. (2019). The Implicit Association Test: A Method in Search of a construct. Perspectives on Psychological Sciencehttps://doi.org/10.1177/1745691619863798

Schimmack, U. (2019). The race IAT: A Case Study of The Validity Crisis in Psychology.
https://replicationindex.com/2019/02/06/the-race-iat-a-case-study-of-the-validity-crisis-in-psychology/

The Implicit Association Test: A Measure in Search of a Construct (in press, PoPS)

Here is a link to the manuscript, data, and MPLUS scripts for reproducibility. https://osf.io/mu7e6/

ABSTRACT

Greenwald et al. (1998) proposed that the IAT measures individual differences in implicit social cognition.  This claim requires evidence of construct validity. I review the evidence and show that there is insufficient evidence for this claim.  Most important, I show that few studies were able to test discriminant validity of the IAT as a measure of implicit constructs. I examine discriminant validity in several multi-method studies and find no or weak evidence for discriminant validity. I also show that validity of the IAT as a measure of attitudes varies across constructs. Validity of the self-esteem IAT is low, but estimates vary across studies.  About 20% of the variance in the race IAT reflects racial preferences. The highest validity is obtained for measuring political orientation with the IAT (64% valid variance).  Most of this valid variance stems from a distinction between individuals with opposing attitudes, while reaction times contribute less than 10% of variance in the prediction of explicit attitude measures.  In all domains, explicit measures are more valid than the IAT, but the IAT can be used as a measure of sensitive attitudes to reduce measurement error by using a multi-method measurement model.

Keywords:  Personality, Individual Differences, Social Cognition, Measurement, Construct Validity, Convergent Validity, Discriminant Validity, Structural Equation Modeling

HIGHLIGHTS

Despite its popularity, relatively little is known about the construct validity of the IAT.

As Cronbach (1989) pointed out, construct validation is better examined by independent experts than by authors of a test because “colleagues are especially able to refine the interpretation, as they compensate for blind spots and capitalize on their own distinctive experience” (p. 163).

It is of utmost importance to determine how much of the variance in IAT scores is valid variance and how much of the variance is due to measurement error, especially when IAT scores are used to provide individualized feedback.

There is also no consensus in the literature whether the IAT measures something different from explicit measures.

In conclusion, while there is general consensus to make a distinction between explicit measures and implicit measures, it is not clear what the IAT measures

To complicate matters further, the validity of the IAT may vary across attitude objects. After all the IAT is a method, just like Likert scales are a method, and it is impossible to say that a method is valid (Cronbach, 1971).

At present, relatively little is known about the contribution of these three parameters to observed correlations in hundreds of mono-method studies.

A Critical Review of Greenwald et al.’s (1998) Original Article

In conclusion, the seminal IAT article introduced the IAT as a measure of implicit constructs that cannot be measured with explicit measures, but it did not really test this dual-attitude model.

Construct Validity in 2007

In conclusion, the 2007 review of construct validity revealed major psychometric challenges for the construct validity of the IAT, which explains why some researchers have concluded that the IAT cannot be used to measure individual differences (Payne et al., 2017).  It also revealed that most studies were mono-method studies that could not examine convergent and discriminant validity

Cunningham, Preacher and Banaji (2001)

Another noteworthy finding is that a single factor accounted for correlations among all measures on the same occasion and across measurement occasions. This finding shows that there were no true changes in racial attitudes over the course of this two-month study.  This finding is important because Cunningham et al.’s (2001) study is often cited as evidence that implicit attitudes are highly unstable and malleable (e.g., Payne et al., 2017). This interpretation is based on the failure to distinguish random measurement error and true change in the construct that is being measured (Anusic & Schimmack, 2016).  While Cunningham et al.’s (2001) results suggest that the IAT is a highly unreliable measure, the results also suggest that the racial attitudes that are measured with the race IAT are highly stable over periods of weeks or months. 

Bar-Anan & Vianello, 2018

this large study of construct validity also provides little evidence for the original claim that the IAT measures a new construct that cannot be measured with explicit measures, and confirms the estimate from Cunningham et al. (2001) that about 20% of the variance in IAT scores reflects variance in racial attitudes.

Greenwald et al. (2009)

“When entered after the self-report measures, the two implicit measures incrementally explained 2.1% of vote intention variance, p=.001, and when political conservativism was also included in the model, “the pair of implicit measures incrementally predicted only 0.6% of voting intention variance, p = .05.”  (Greenwald et al., 2009, p. 247).

I tried to reproduce these results with the published correlation matrix and failed to do so. I contacted Anthony Greenwald, who provided the raw data, but I was unable to recreate the sample size of N = 1,057. Instead I obtained a similar sample size of N = 1,035.  Performing the analysis on this sample also produced non-significant results (IAT: b = -.003, se = .044, t = .070, p = .944; AMP: b = -.014, se = .042, t = 0.344, p = .731).  Thus, there is no evidence for incremental predictive validity in this study.

Axt (2018)

With N = 540,723 respondents, sampling error is very small, σ = .002, and parameter estimates can be interpreted as true scores in the population of Project Implicit visitors.  A comparison of the factor loadings shows that explicit ratings are more valid than IAT scores. The factor loading of the race IAT on the attitude factor once more suggests that about 20% of the variance in IAT scores reflects racial attitudes

Falk, Heine, Zhang, and Hsu (2015)

Most important, the self-esteem IAT and the other implicit measures have low and non-significant loadings on the self-esteem factor. 

Bar-Anan & Vianello (2018)

Thus, low validity contributes considerably to low observed correlations between IAT scores and explicit self-esteem measures.

Bar-Anan & Vianello (2018) – Political Orientation

More important, the factor loading of the IAT on the implicit factor is much higher than for self-esteem or racial attitudes, suggesting over 50% of the variance in political orientation IAT scores is valid variance, π = .79, σ = .016.  The loading of the self-report on the explicit ratings was also higher, π = .90, σ = .010

Variation of Implicit – Explicit Correlations Across Domains

This suggests that the IAT is good in classifying individuals into opposing groups, but it has low validity of individual differences in the strength of attitudes.

What Do IATs Measure?

The present results suggest that measurement error alone is often sufficient to explain these low correlations.  Thus, there is little empirical support for the claim that the IAT measures implicit attitudes that are not accessible to introspection and that cannot be measured with self-report measures. 

For 21 years the lack of discriminant validity has been overlooked because psychologists often fail to take measurement error into account and do not clearly distinguish between measures and constructs.

In the future, researchers need to be more careful when they make claims about constructs based on a single measure like the IAT because measurement error can produce misleading results.

Researchers should avoid terms like implicit attitude or implicit preferences that make claims about constructs simply because attitudes were measured with an implicit measure

Recently, Greenwald and Banaji (2017) also expressed concerns about their earlier assumption that IAT scores reflect unconscious processes.  “Even though the present authors find themselves occasionally lapsing to use implicit and explicit as if they had conceptual meaning, they strongly endorse the empirical understanding of the implicit– explicit distinction” (p. 862).

How Well Does the IAT Measure What it Measures?

Studies with the IAT can be divided into applied studies (A-studies) and basic studies (B-studies).  B-studies employ the IAT to study basic psychological processes.  In contrast, A-studies use the IAT as a measure of individual differences. Whereas B-studies contribute to the understanding of the IAT, A-studies require that IAT scores have construct validity.  Thus, B-studies should provide quantitative information about the psychometric properties for researchers who are conducting A-studies. Unfortunately, 21 years of B-studies have failed to do so. For example, after an exhaustive review of the IAT literature, de Houwer et al. (2009) conclude that “IAT effects are reliable enough to be used as a measure of individual differences” (p. 363).  This conclusion is not helpful for the use of the IAT in A-studies because (a) no quantitative information about reliability is given, and (b) reliability is necessary but not sufficient for validity.  Height can be measured reliably, but it is not a valid measure of happiness. 

This article provides the first quantitative information about validity of three IATs.  The evidence suggests that the self-esteem IAT has no clear evidence of construct validity (Falk et al., 2015).  The race-IAT has about 20% valid variance and even less valid variance in studies that focus on attitudes of members from a single group.  The political orientation IAT has over 40% valid variance, but most of this variance is explained by group-differences and overlaps with explicit measures of political orientation.  Although validity of the IAT needs to be examined on a case by case basis, the results suggest that the IAT has limited utility as a measurement method in A-studies.  It is either invalid or the construct can be measured more easily with direct ratings.

Implications for the Use of IAT scores in Personality Assessment

I suggest to replace the reliability coefficient with the validity coefficient.  For example, if we assume that 20% of the variance in scores on the race IAT is valid variance, the 95%CI for IAT scores from Project Implicit (Axt, 2018), using the D-scoring method, with a mean of .30 and a standard deviation of.46 ranges from -.51 to 1.11. Thus, participants who score at the mean level could have an extreme pro-White bias (Cohen’s d = 1.11/.46 = 2.41), but also an extreme pro-Black Bias (Cohen’s d = -.51/.46 = -1.10).  Thus, it seems problematic to provide individuals with feedback that their IAT score may reveal something about their attitudes that is more valid than their beliefs. 

Conclusion

Social psychologists have always distrusted self-report, especially for the measurement of sensitive topics like prejudice.  Many attempts were made to measure attitudes and other constructs with indirect methods.  The IAT was a major breakthrough because it has relatively high reliability compared to other methods.  Thus, creating the IAT was a major achievement that should not be underestimated because the IAT lacks construct validity as a measure of implicit constructs. Even creating an indirect measure of attitudes is a formidable feat. However, in the early 1990s, social psychologists were enthralled by work in cognitive psychology that demonstrated unconscious or uncontrollable processes (Greenwald & Banaji, 1995). Implicit measures were based on this work and it seemed reasonable to assume that they might provide a window into the unconscious (Banaji & Greenwald, 2013). However, the processes that are involved in the measurement of attitudes with implicit measures are not the personality characteristics that are being measured.  There is nothing implicit about being a Republican or Democrat, gay or straight, or having low self-esteem.  Conflating implicit processes in the measurement of attitudes with implicit personality constructs has created a lot of confusion. It is time to end this confusion. The IAT is an implicit measure of attitudes with varying validity.  It is not a window into people’s unconscious feelings, cognitions, or attitudes.

The (lacking) predictive validity of the race IAT

Good science requires valid measures. This statement is hardly controversial. Not surprisingly, all authors of some psychological measure claim that their measure is valid. However, validation research is expensive and difficult to publish in prestigious journals. As a result, psychological science has a validity crisis. Many measures are used in hundreds of articles without clear definitions of constructs and without quantitative information about their validity (Schimmack, 2010).

The Implicit Association Test (AT) is no exception. The IAT was introduced in 1998 with strong and highly replicable evidence that average attitudes towards objects pairs (e.g., flowers vs. spiders) can be measured with reaction times in a classification task (Greenwald et al., 1998). Although the title of the article promised a measure of individual differences, the main evidence in the article were mean differences between groups. Thus, the original article provided little evidence that the IAT is a valid measure of individual differences.

The use of the IAT as a measure of individual differences in attitudes requires scientific evidence that tests scores are linked to variation in attitudes. Key evidence for the validity of a test are reliability, convergent validity, discriminant validity, and incremental predictive validity (Campbell & Fiske, 1959).

The validity of the IAT as a measure of attitudes has to be examined on a case by case basis because the link between associations and attitudes can vary depending on the attitude object. For attitude objects like pop drinks, Coke vs. Pepsi, associations may be strongly related to attitudes. In fact, the IAT has good predictive validity for choices between two pop drinks (Hofmann, Gawronski, Gschwendner, & Schmitt, 2005). However, it lacks convergent validity when it is used to measure self-esteem (Bosson & Swan, & Pennebaker, 2000).

The IAT is best known as a measure of prejudice, racial bias, or attitudes of White Americans towards African Americans. On the one hand, the inventor of the IAT, Greenwald, argues that the race IAT has predictive validity (Greenwald et al., 2009). Others take issue with the evidence: “Implicit Association Test scores did not permit prediction of individual-level behaviors” (Blanton et al., 2009, p. 567); “the IAT provides little insight into who will discriminate against whom, and provides no more insight than explicit measures of bias” (Oswald et al., 2013).

Nine years later, Greenwald and colleagues present a new meta-analysis of predictive validity of the IAT (Kurdi et al., 2018) based on 217 research reports and a total sample size of N = 36,071 participants. The results of this meta-analysis are reported in the abstract.

We found significant implicit– criterion correlations (ICCs) and explicit– criterion correlations (ECCs), with unique contributions of implicit (beta = .14) and explicit measures (beta = .11) revealed by structural equation modeling.

The problem with meta-analyses is that they aggregate information with diverse methods, measures, and criterion variables, and the meta-analysis showed high variability in predictive validity. Thus, the headline finding does not provide information about the predictive validity of the race IAT. As noted by the authors, “Statistically, the high degree of heterogeneity suggests that any single point estimate of the implicit– criterion relationship would be misleading” (p. 7).

Another problem of meta-analysis is that it is difficult to find reliable moderator variables if original studies have small samples and large sampling error. As a result, a non-significant moderator effect cannot be interpreted as evidence that results are homogeneous. Thus, a better way to examine the predictive validity of the race IAT is to limit the meta-analysis to studies that used the race IAT.

Another problem of small studies is that they introduce a lot of noise because point estimates are biased by sampling error. Stanley, Jarrell, and Doucouliagos (2010) made the ingenious suggestion to limit meta-analysis to the top 10% of studies with the largest sample sizes. As these studies have small sampling error to begin with, aggregating them will produce estimates with even smaller sampling error and inclusion of many small studies with high heterogeneity is not necessary. A smaller number of studies also makes it easier to evaluate the quality of studies and to examine sources of heterogeneity across studies. I used this approach to examine the predictive validity of the race IAT using the studies included in Kurdi et al.’s (2018) meta-analysis (data).

Description of the Data

The datafile contained the variable groupStemCat2 that coded the groups compared in the IAT. Only studies classified as groupStemCat2 == “African American and Africans” were selected, leaving 1328 entries (rows). Next, I selected only studies with an IAT-criterion correlation, leaving 1004 entries. Next, I selected only entries with a minimum sample size of N = 100, leaving 235 entries (more than 10%).

The 235 entries were based on 21 studies, indicating that the meta-analysis coded, on average, more than 10 different effects for each study.

The median IAT-criterion correlation across all 235 studies was r = .070. In comparison, the median r for the 769 studies with N < 100 was r = .044. Thus, selecting for studies with large N did not reduce the effect size estimate.

When I first computed the median for each study and then the median across studies, I obtained a similar median correlation of r = .065. There was no significant correlation between sample size and median ICC-criterion correlation across the 21 studies, r = .12. Thus, there is no evidence of publication bias.

I now review the 21 studies in decreasing order of the median IAT-criterion correlation. I evaluate the quality of the studies with 1 to 5 stars ranging from lowest to highest quality. As some studies were not intended to be validation studies, this evaluation does not reflect the quality of a study per se. The evaluation is based on the ability of a study to validate the IAT as a measure of racial bias.

1. * Ma et al. (Study 2), N = 303, r = .34

Ma et al. (2012) used several IATs to predict voting intentions in the 2012 US presidential election. Importantly, Study 2 did not include the race IAT that was used in Study 1 (#15, median r = .03). Instead, the race IAT was modified to include pictures of the two candidates Obama and Romney. Although it is interesting that an IAT that requires race classifications of candidates predicted voting intentions, this study cannot be used to claim that the race IAT as a measure of racial bias has predictive validity because the IAT measures specific attitudes towards candidates rather than attitudes towards African Americans in general.

2. *** Knowles et al., N = 285, r = .26

This study used the race IAT to predict voting intentions and endorsement of Obama’s health care reforms. The main finding was that the race IAT was a significant predictor of voting intentions (Odds Ratio = .61; r = .20) and that this relationship remained significant after including the Modern Racism scale as predictor (Odds Ratio = .67, effect size r = .15). The correlation is similar to the result obtained in the next study with a larger sample.

3. ***** Greenwald et al. (2009), N = 1,057, r = .17

The most conclusive results come from Greenwald et al.’s (2009) study with the largest sample size of all studies. In a sample of N = 1,057 participants, the race IAT predicted voting intentions in the 2008 US election (Obama vs. McCain), r = .17. However, in a model that included political orientation as predictor of voting intentions, only explicit attitude measures added incremental predictive validity, b = .10, SE = .03, t = 3.98, but the IAT did not, b = .00, SE = .02, t = 0.18.

4. * Cooper et al., N = 178, r = .12

The sample size in the meta-analysis does not match the sample size of the original study. Although 269 patients were involved, the race IAT was administered to 40 primary care clinicians. Thus, predictive validity can only be assessed on a small sample of N = 40 physicians who provided independent IAT scores. Table 3 lists seven dependent variables and shows two significant results (p = .02, p = .02) for Black patients.

5. * Biernat et al. (Study 1), N = 136, r = .10

Study 1 included the race IAT and donations to a Black vs. other student organizations as the criterion variable. The negative relationship was not significant (effect size r = .05). The meta-analysis also included the shifting standard variable (effect size r = .14). Shifting standards refers to the extent to which participants shifted standards in their judgments of Black versus White targets’ academic ability. The main point of the article was that shifting standards rather than implicit attitude measures predict racial bias in actual behavior. “In three studies, the tendency to shift standards was uncorrelated with other measures of prejudice but predicted reduced allocation of funds to a Black student organization.” Thus, it seems debatable to use shifting standards as a validation criterion for the race IAT because the key criterion variable were the donations, while shifting standards were a competing indirect measure of prejudice.

6. ** Zhang et al. (Study 2), N = 196, r = .10

This study examined thought listings after participants watched a crime committed by a Black offender on Law and Order. “Across two programs, no statistically significant relations between the nature of the thoughts and the scores on IAT were found, F(2, 85) = 2.4, p < .11 for program 1, and F(2, 84) = 1.98, p < .53 for program 2.” The main limitation of this study is that thought listings are not a real social behavior. As the effect size for this study is close to the median, excluding it has no notable effect on the final result.

7. * Ashburn et al., N = 300, r = .09

The title of this article is “Race and the psychological health of African Americans.” The sample consists of 300 African American participants. Although it is interesting to examine racial attitudes of African Americans, this study does not address the question whether the race IAT is a valid measure of prejudice against African Americans.

8. *** Eno et al. (Study 1), N = 105, r = .09

This article examines responses to a movie set during the Civil Rights Era; “Remember the Titans.” After watching the movie, participants made several ratings about interpretations of events. Only one event, attributing Emma’s actions to an accident, showed a significant correlation with the IAT, r = .20, but attributions to racism also showed a correlation in the same direction, r = .10. For the other events, attributions had the same non-significant effect size, Girls interests r = .12, Girls race, r = .07; Brick racism, r = -.10, Brick Black coach’s actions, r = -.10.

9. *** Aberson & Haag, N = 153, r = .07

Abserson and Haag administered the race IAT to 153 participants and asked questions about quantity and quality of contact with African Americans. They found non-significant correlations with quantity, r = -.12 and quality, r = -.10, and a significant positive correlation with the interaction, r = .17. The positive interaction effect suggests that individuals with low contact, which implies low quality contact as well, are not different from individuals with frequent high quality contact.

10. *Hagiwara et al., N = 106, r = .07

This study is another study of Black patients and non-Black physician. The main limitation is that there were only 14 physicians and only 2 were White.

11. **** Bar-Anan & Nosek, N = 397, r = .06

This study used contact as a validation criterion. The race IAT showed a correlation of r = -.14 with group contact. , N in the range from 492-647. The Brief IAT showed practically the same relationship, r = -.13. The appendix reports that contact was more strongly correlated with the explicit measures; thermometer r = .27, preference r = .31. Using structural equation modeling, as recommended by Greenwald and colleagues, I found no evidence that the IAT has unique predictive validity in the prediction of contact when explicit measures were included as predictors, b = .03, SE = .07, t = 0.37.

12. *** Aberson & Gaffney, N = 386, median r = .05

This study related the race IAT to measures of positive and negative contact, r = .10, r = -.01, respectively. Correlations with an explicit measure were considerably stronger, r = .38, r = -.35, respectively. These results mirror the results presented above.

13. * Orey et al., N = 386, median r = .04

This study examined racial attitudes among Black respondents. Although this is an interesting question, the data cannot be used to examine the predictive validity of the race IAT as a measure of prejudice.

14. * Krieger et al., N = 708, median r = .04

This study used the race IAT with 442 Black participants and criterion measures of perceived discrimination and health. Although this is a worthwhile research topic, the results cannot be used to evaluate the validity of the race IAT as a measure of prejudice.

15. *** Ma et al. (Study 1), N = 335, median r = .03

This study used the race IAT to predict voter intentions in the 2012 presidential election. The study found no significant relationship. “However, neither category-level measures were related to intention to vote for Obama (rs ≤ .06, ps ≥ .26)” (p. 31). The meta-analysis recorded a correlation of r = .045, based on email correspondence with the authors. It is not clear why the race IAT would not predict voting intentions in 2012, when it did predict voting intentions in 2008. One possibility is that Obama was now seen as a an individual rather than as a member of a particular group so that general attitudes towards African Americans no longer influenced voting intentions. No matter what the reason is, this study does not provide evidence for the predictive validity of the race IAT.

16. **** Oliver et al., N = 105, median r = .02

This study was on online study of 543 family and internal medicine physicians. They completed the race IAT and gave treatment recommendations for a hypothetical case. Race of the patient was experimentally manipulated. The abstract states that “physicians possessed explicit and implicit racial biases, but those biases did not predict
treatment recommendations” (p. 177). The sample size in the meta-analysis is smaller because the total sample was broken down into smaller subgroups.

17. * Nosek & Hansen, N = 207, median r = .01

This study did not include a clear validation criterion. The aim was to examine the relationship between the race IAT and cultural knowledge about stereoetypes. “In seven studies (158 samples, N = 107,709), the IAT was reliably and variably related to explicit attitudes, and explicit attitudes accounted for the relationship between the IAT and cultural knowledge.” The cultural knowledge measures were used as criterion variables. A positive relation, r = .10, was obtained for the item “If given the choice, who would most employers choose to hire, a Black American or a White American? (1 definitely White to 7 definitely Black).” A negative relation, r = -.09, was obtained for the item “Who is more likely to be a target of discrimination, a Black American or a White American? (1 definitely White to 7 definitely Black).”

18. *Plant et al., N = 229, median r = .00

This article examined voting intentions in a sample of 229 students. The results are not reported in the article. The meta-analysis reported a positive r = .04 and a negative r = -.04 for two separate entries with different explicit measures, which must be a coding mistake. As voting behavior has been examined in larger and more representative samples (#3, #15), these results can be ignored.

19. *Krieger et al. (2011), N = 503, r = .00

This study recruited 504 African Americans and 501 White Americans. All participants completed the race IAT. However, the study did not include clear validation criteria. The meta-analysis used self-reported experiences of discrimination as validation criterion. However, the important question is whether the race IAT predicts behaviors of people who discriminate, not the experience of victims of discrimination.

20. *Fiedorowicz, N = 257, r = -.01

This study is a dissertation and the validation criterion was religious fundamentalism.

21. *Heider & Skowronski, N = 140, r = -.02

This study separated the measurement of prejudice with the race IAT and the measurement of the criterion variables by several weeks. The criterion was cooperative behavior in a prisoner dilemma game. The results showed that “both the IAT (b = -.21, t = -2.51, p = .013) and the Pro-Black subscore (b = .17, t = 2.10, p = .037) were significant predictors of more cooperation with the Black confederate. However, these results were false and have been corrected (see Carlsson et al., 2018, for a detailed discussion).

Heider, J. D., & Skowronski, J.J. (2011). Addendum to Heider and Skowronski (2007): Improving the predictive validity of the Implicit Association Test. North American Journal of Psychology, 13, 17-20

Discussion

In summary, a detailed examination of the race IAT studies included in the meta-analysis shows considerable heterogeneity in the quality of the studies and their ability to examine the predictive validity of the race IAT. The best study is Greenwald et al.’s (2009) study with a large sample and voting in the Obama vs. McCain race as the criterion variable. However, another voting study failed to replicate these findings in 2012. The second best study was BarAnan and Nosek’s study with intergroup contact as a validation criterion, but it failed to show incremental predictive validity of the IAT.

Studies with physicians show no clear evidence of racial bias. This could be due to the professionalism of physicians and the results should not be generalized to the general population. The remaining studies were considered unsuitable to examine predictive validity. For example, some studies with African American participants did not use the IAT to measure prejudice.

Based on this limited evidence it is impossible to draw strong conclusions about the predictive validity of the race IAT. My assessment of the evidence is rather consistent with the authors of the meta-analysis, who found that “out of the 2,240 ICCs included in this metaanalysis, there were only 24 effect sizes from 13 studies that (a) had the relationship between implicit cognition and behavior as their primary focus” (p. 13).

This confirms my observation in the introduction that psychological science has a validation crisis because researchers rarely conduct validation studies. In fact, despite all the concerns about replicability, the lack of replication studies are much more numerous than validation studies. The consequences of the validation crisis is that psychologists routinely make theoretical claims based on measures with unknown validity. As shown here, this is also true for the IAT. At present, it is impossible to make evidence-based claims about the validity of the IAT because it is unknown what the IAT measures and how well it measures what it measures.

Theoretical Confusion about Implicit Measures

The lack of theoretical understanding of the IAT is evident in Greenwald and Banaji’s (2017) recent article, where they suggest that “implicit cognition influences explicit cognition that, in turn, drives behavior” (Kurdi et al., p. 13). This model would imply that implicit measures like the IAT do not have a direct link to behavior because conscious processes ultimately determine actions. This speculative model is illustrated with Bar-Anan and Nosek’s (#11) data that showed no incremental predictive validity on contact. The model can be transformed into a causal chain by changing the bidiretional path into an assumed causal relationship between implicit and explicit attitudes.

However, it is also possible to change the model into a single factor model, that considers unique variance in implicit and explicit measures as mere method variance.

Thus, any claims about implicit bias and explicit bias is premature because the existing data are consistent with various theoretical models. To make scientific claims about implicit forms of racial bias, it would be necessary to obtain data that can distinguish empirically between single construct and dual-construct models.

Conclusion

The race IAT is 20 years old. It has been used in hundreds of articles to make empirical claims about prejudice. The confusion between measures and constructs has created a public discourse about implicit racial bias that may occur outside of awareness. However, this discourse is removed from the empirical facts. The most important finding of the recent meta-analysis is that a careful search of the literature uncovered only a handful of serious validation studies and that the results of these studies are suggestive at best. Even if future studies would provide more conclusive evidence of incremental predictive validity, this finding would be insufficient to claim that the IAT is a valid measure of implicit bias. The IAT could have incremental predictive validity even if it were just a complementary measure of consciously accessible prejudice that does not share method variance with explicit measures. A multi-method approach is needed to examine the construct validity of the IAT as a measure of implicit race bias. Such evidence simply does not exist. Greenwald and colleagues had 20 years and ample funding to conduct such validation studies, but they failed to do so. In contrast, their articles consistently confuse measures and constructs and give the impression that the IAT measures unconscious processes that are hidden from introspection (“conscious experience provides only a small window into how the mind works”, “click here to discover your hidden thoughts”).

Greenwald and Banaji are well aware that their claims matter. “Research on implicit social cognition has witnessed higher levels of attention both from the general public and from governmental and commercial entities, making regular reporting of what is known an added responsibility” (Kurdi et al., 2018, p. 3). I concur. However, I do not believe that their meta-analysis fulfills this promise. An unbiased assessment of the evidence shows no compelling evidence that the race IAT is a valid measure of implicit racial bias; and without a valid measure of implicit racial bias it is impossible to make scientific statements about implicit racial bias. I think the general public deserves to know this. Unfortunately, there is no need for scientific evidence that prejudice and discrimination still exists. Ideally, psychologists will spend more effort in developing valid measures of racism that can provide trustworthy information about variation across individuals, geographic regions, groups, and time. Many people believe that psychologists are already doing it, but this review of the literature shows that this is not the case. It is high time to actually do what the general public expects from us.

No Incremental Predictive Validity of Implicit Attitude Measures

The general public has accepted the idea of implicit bias; that is, individuals may be prejudice without awareness. For example, in 2018 Starbucks closed their stores for one day to train employees to detect and avoid implicit bias (cf. Schimmack, 2018).

However, among psychological scientists the concept of implicit bias is controversial (Blanton et al., 2009; Schimmack, 2019). The notion of implicit bias is only a scientific construct if it can be observed with scientific methods, and this requires valid measures of implicit bias.

Valid measures of implicit bias require evidence of reliability, convergent validity, discriminant validity, and incremental predictive validity. Proponents of implicit bias claim that measures of implicit bias have demonstrated these properties. Critics are not convinced.

For example, Cunningham, Preacher, and Banaji (2001) conducted a multi-method study and claimed that their results showed convergent validity among implicit measures and that implicit measures correlated more strongly with each other than with explicit measures. However, Schimmack (2019) demonstrated that a model with a single factor fit the data better and that the explicit measures loaded higher on this factor than the evaluative priming measure. This finding challenges the claim that implicit measures possess discriminant validity. That is, the are implicit measures of racial bias, but they are not measures of implicit racial bias.

A forthcoming meta-analysis claims that implicit measures have unique predictive validity (Kurdi et al., 2018). The average effect size for the correlation between an implicit measure and a criterion was r = .14. However, this estimate is based on studies across many different attitude objects and includes implicit measures of stereotypes and identity. Not surprisingly, the predictive validity was heterogeneous. Thus, the average does not provide information about the predictive validity of the race IAT as a measure of implicit bias. The most important observation was that sample sizes of many studies were too small to investigate predictive validity given the small expected effect size. Most studies had sample sizes with fewer than 100 participants (see Figure 1).

A notable exception is a study of voting intentions in the historic 2008 presidential election, where US voters had a choice to elect the first Black president, Obama, or the Republican candidate McCain. A major question at that time was how much race and prejudice would influence the vote. Greenwald, Tucker Smith, Sriram, Bar-Anan, and Nosek (2009) conducted a study to address this question. They obtained data from N = 1,057 participants who completed online implicit measures and responded to survey questions. The key outcome variable was a simple dichotomous question about voting intentions. The sample was not a national representative sample as indicated by 84.2% declared votes for Obama versus 15.8% declared votes for McCain. The predictor variables were two self-report measures of prejudice (feeling-thermometer, Likert scale), two implicit measures (Brief IAT, AMP), the Symbolic Racism Scale, and a measure of political orientation (Conservative vs. Liberal).

The correlation among all measures were reported in Table 1.

The results for the Brief IAT (BIAT) are highlighted. First, the BIAT does predict voting intentions (r = .17). Second, the BIAT shows convergent validity with the second implicit measure; the Affective Missattribution Paradigm (AMP). Third, the IAT also correlates with the explicit measures of racial bias. Most important, the correlations with the implicit AMP are weaker than the correlations with the explicit measures. This finding confirms Schimmack’s (2019) finding that implicit measures lack discriminant validity.

The correlation table does not address the question whether implicit measures have incremental predictive validity. To examine this question, I fit a structural equation model to the reproduced covariance matrix based on the reported correlations and standard deviations using MPLUS8.2. The model shown in Figure 1 had good overall fit, chi2(9, N = 1057) = 15.40, CFI = .997, RMSEA = .026, 90%CI = .000 to .047.

The model shows that explicit and implicit measures of racial bias load on a common factor (att). Whereas the explicit measures share method variance, the residuals of the two implicit measures are not correlated. This confirms the lack of discriminant validity. That is, there is no unique variance shared only by implicit measures. The strongest predictor of voting intentions is political orientation. Symbolic racism is a mixture of conservatism and racial bias, and it has no unique relationship with voting intentions. Racial bias does make a unique contribution to voting intentions, (b = .22, SE = .05, t = 4.4). The blue path shows that the BIAT does have predictive validity above and beyond political orientation, but the effect is indirect. That is, the IAT is a measure of racial bias and racial bias contributes to voter intentions. The red path shows that the BIAT has no unique relationship with voting intentions. The negative coefficient is not significant. Thus, there is no evidence that the unique variance in the BIAT reflects some form of implicit racial bias that influences voting intentions.

In short, these results provide no evidence for the claim that implicit measures tap implicit racial biases. In fact, there is no scientific evidence for the concept of implicit bias, which would require evidence of discriminant validity and incremental validity.

Conclusion

The use of structural equation modeling (SEM) was highly recommended by the authors of the forthcoming meta-analysis (Kurdi et al., 2018). Here I applied SEM used the best data with multiple explicit and implicit measures, an important criterion variable, and a large sample size that is sufficient to detect small relationships. Contrary to the meta-analysis, the results do not support the claim that implicit measures have incremental predictive validity. In addition, the results confirmed Schimmack’s (2019) results that implicit measures lack discriminant validity. Thus, the construct of implicit racial bias lacks empirical support. Implicit measures like the IAT are best considered as implicit measures of racial bias that is also reflected in explicit measures.

With regard to the political question whether racial bias influenced voting in the 2008 election, these results suggest that racial bias did indeed matter. Using only explicit measures would have underestimated the effect of racial bias due to the substantial method variance in these measures. Thus, the IAT can make an important contribution to the measurement of racial bias because it doesn’t share method variance with explicit measures.

In the future, users of implicit measures need to be more careful in their claims about the construct validity of implicit measures. Greenwald et al. (2009) constantly conflate implicit measures of racial bias with measures of implicit racial bias. For example, the title claims “Implicit Race Attitudes Predicted Vote” , the term “Implicit race attitude measure” is ambiguous because it could mean implicit measure or implicit attitude, whereas the term “implicit measures of race attitudes” implies that the measures are implicit but the construct is racial bias; otherwise it would be “implicit measures of implicit racial bias.” The confusion arises from a long tradition in psychology to conflate measures and constructs (e.g., intelligence is whatever an IQ test measures) (Campbell & Fiske, 1959). Structural equation modeling makes it clear that measures (boxes) and constructs (circles) are distinct and that measurement theory is needed to relate measures to constructs. At present, there is clear evidence that implicit measures can measure racial bias, but there is no evidence that attitudes have an explicit and an implicit component. Thus, scientific claims about racial bias do not support the idea that racial bias is implicit. This idea is based on the confusion of measures and constructs in the social cognition literature.