

Abstract
Social psychology suffers from a replication crisis because publication bias undermines the evidential value of published significant results. Meta-analysis that do not correct for publication bias are biased and cannot be used to estimate effect sizes. Here I show that a meta-analysis of the ease-of-retrieval effect (Weingarten & Hutchinson, 2018) did not fully correct for publication bias and that 200 significant results for the ease-of-retrieval effect can be fully explained by publication bias. This conclusion is consistent with the results of the only registered replication study of ease of retrieval (Groncki et al., 2021). As a result, there is no empirical support for the ease-of-retrieval effect. Implications for the credibility of social psychology are discussed.
Introduction
Until 2011, social psychology appeared to have made tremendous progress. Daniel Kahneman (2011) reviewed many of the astonishing findings in his book “Thinking: Fast and Slow.” His book used Schwarz et al.’s (2011) ease-of-retrieval research as an example of rigorous research on social judgments.
The ease-of-retrieval paradigm is simple. Participants are assigned to two groups. In one group, they are asked to recall a small number of examples from memory. The number is chosen to make it easy to do this. In the other conditions, participants are asked to recall a larger number of examples. The number is chosen so that it is hard to come up with the requested number of examples. This task is used to elicit a feeling of ease or difficulty. Hundreds of studies have used this paradigm to study the influence of ease-of-retrieval on a variety of judgments.
In the classic studies that introduced the paradigm, participants were asked to retrieve a few or many examples of assertiveness behaviors before answering a question about their assertiveness. Three studies suggested that participants based their personality judgments on the ease of retrieval.
However, this straightforward finding is not always found. Kahneman points out that participants sometimes do not rely on the ease of retrieval. Paradoxically, they sometimes rely on the number of examples they retrieved even though the number was given by the experimenter. What made ease-of-retrieval a strong theory was that ease of retrieval researchers seemed to be able to predict the conditions that made people use ease as information and the conditions when they would use other information. “The proof that you truly understand a pattern of behavior is that you know how to reverse it” (Kahneman, 2011).
This success story had one problem. It was not true. In 2011, it became apparent that social psychologists used questionable research practices to produce significant results. Thus, rather than making amazing predictions about the outcome of studies, they searched for statistical significance and then claimed that they predicted these effects (John, Loewenstein, & , 2012; Kerr, 1998). Since 2011, it has become clear that only a small percentage of results in social psychology can be replicated without questionable practices (Open Science Collaboration, 2015).
I had my doubts about the ease-of-retrieval literature because I had heard rumors that researchers were unable to replicate these effects, but it was common not to publish these replication failures. My suspicions appeared to be confirmed, when John Krosnick gave a talk about a project that replicated 12 experiments in a large nationally representative sample. All but one experiment was successfully replicate. The exception was the ease-of-retrieval study; a direct replication of Schwarz et al.’s (1991) assertiveness studies. These results were published several years later (Yeager et al., 2019).
I was surprised when Weingarten and Hutchinson (2018) published a detailed and comprehensive meta-analysis of published and unpublished ease-of-retrieval studies and found evidence for a moderate effect size (d ~ .4) even after correcting for publication bias. This conclusion based on many small studies seemed inconsistent with the replication failure in the large national representative sample (Yeager et al., 2019). Moreover, the first pre-registered direct replication of Schwarz et al. (1991) also produced a replication failure (Groncki et al., 2021). One possible explanation for the discrepancy between the meta-analytic results and the replication results could be that the meta-analysis did not fully correct for publication bias. To test this hypothesis, I used the openly shared data to examine the robustness of the effect size estimate. I also conducted a new meta-analysis that included studies published after 2014, using a different coding of studies that codes only one focal hypothesis test per study. The results showed that the effect size estimate in Weingarten and Hutchinson’s (2018) is not robust and depends heavily on outliers. I also find that the coding scheme attenuates the detection of bias which leads to inflated effect size estimates. The new meta-analysis shows an effect size estimate close to zero. It also shows that heterogeneity is fully explained by publication bias.
Reproducing the Original Meta-Analysis
All effect sizes are Fisher-z transformed correlation coefficients. The predictor is the standard error; 1/sqrt(N – 3). Figure 1 reproduces the funnel plot in Weingarten and Hutchinson (2018), with the exception that sampling error is plotted on the x-axis and effect sizes are plotted on the y-axis.

Figure 1 also includes the predictions (regression lines) for three models. The first model is an unweighted average. This model assumes that there is no publication bias. The straight orange line shows that this model assumes an average effect size of z = .23 for all sample sizes. The second model assumes that there is publication bias and that bias increases in a linear fashion with sampling error. The slope of the blue regression line is significance and suggests that publication bias is present. The intercept of this model can be interpreted as the unbiased effect size estimate (Stanley, 2017). The intercept is z = .115 with a 95% confidence interval that ranges from .036 to .193. These results reproduce the results in Weingarten and Hutchinson (2018) closely, but not exactly, r = .104, 95%CI = .034 to .172. Simulation studies suggest that this effect size estimate underestimates the true effect size when the intercept is significantly different from zero (Stanley, 2017). In this case, it is recommended to use the variance (sampling error squared) as a model of publication bias. The red curve shows the predictions of this model. Most important, the intercept is now nearly at the same level as the model without publication bias, z = .221, 95%CI = .174 to .267. Once more, these results closely reproduce the published results, r = .193, 95%CI = .153 to .232.
The problem with unweighted models is that data points from small studies are given equal weights to studies with large samples. In this particular case, small studies are given even more weight than larger studies because small studies with extremely small sample sizes (N < 20) are outliers and outliers are weighted more heavily in regression analysis. Inspection of the scatter plot shows that 7 studies with sample sizes less than 10 (5 per condition) have a strong influence on the regression line. As a result, all three regression lines in Figure 1 overestimate effect sizes for studies with more than 100 participants. Thus, the intercept overestimates the effect sizes for large studies, including Yeager et al.’s (2019) study with N = 1,323 participants. In short, the effect size estimate in the meta-analysis is strongly influenced by 7 data points that represent fewer than 100 participants.
A simple solution to this problem is to weight observations by sample size so that larger samples are given more weight. This is actually the default option for many meta-analysis programs like the metafor package in R (Viechbauer, 2010). Thus, I reran the same analyses with weighting of observations by sample size. Figure 2 shows the results. In Figure 2 the size of observations reflects weights. The most important difference in the results is that the intercept for the model with a linear effect of sampling error is practically zero and not statistically significant, z = .006, 95%CI = -.040 to .052. The confidence interval is small enough to infer that the typical effect size is close enough to zero to accept the null-hypothesis.

Proponents of ease-of-retrieval will, however, not be satisfied with this answer. First, inspection of Figure 2 shows that the intercept is now strongly influenced by a few large samples. Moreover, the model does show heterogeneity in effect sizes, I2 = 33.38%, suggesting that at least some of the significant results were based on real effects.
Coding of Studies
Effect size meta-analysis evolved without serious consideration of publication bias. Although publication bias has been known to be present since meta-analysis was invented (Sterling, 1959), it was often an afterthought rather than part of the meta-analytic model (Rosenthal, 1979). Without having to think about publication bias, it became a common practice to code individual studies without a focus on the critical test that was used to publish a study. This practice obscures the influence of publication bias and may lead to an overestimation of the average effect size. To illustrate this, I am going to focus on the 7 data points in Figure 1 that were coded with sample sizes less than 10.
Six of the observations stem from an unpublished dissertation by Bares (2007) that was supervised by Norbert Schwarz. The dissertation was a study with children. The design had the main manipulation of ease of retrieval (few vs. many) as a between subject factor. Additional factors were gender, age (kindergartners vs. second graders) and 5 content domains (books, shy, friendly, nice, mean). The key dependent variable were frequency estimates. The total sample size was 198, with 98 participants in the easy condition and 100 in the difficult condition. The hypothesis was that ease-of-retrieval would influence judgments independent of gender or content. However, rather than testing the overall main effect across all participants, the dissertation presents analyses separately for different ages and contents. This led to the coding of this study with a reasonable sample size of N = 198 as 20 effects with sample sizes of N = 7 to 9. Only six of these effects were included in the meta-analysis. Thus, the meta-analysis added 6 studies with non-significant results, when there was only one study with non-significant results that was put in the file-drawer. As a result, the meta-analysis does no longer represent the amount of publication bias in the ease-of-retrieval literature. Adding these six effects to the meta-analysis makes the data look less biased and attenuates the regression of effect sizes on sampling error, which in turn leads to a higher intercept. Thus, traditional coding of effect sizes in meta-analyses can lead to inflated effect size estimates even in models that aim to correct for publication bias.
An Updated Meta-Analysis of Ease-of-Retrieval
Building on Weingarten and Hutchinson’s (2018) meta-analysis, I conducted a new meta-analysis that relied on test statistics that were reported to test ease-of-retrieval effects. I only used published articles because the only reason to search for unpublished studies is to correct for publication bias. However, Weingarten and Hutchinson’s meta-analysis showed that publication bias is still present even with a diligent attempt to obtain all data. I extended the time frame of the meta-analysis by searching for new publications since the last year that was included in Weingarten and Hutchinson’s meta-analysis (i.e., 2014). For each study, I looked for the focal hypothesis test of the ease-of-retrieval effect. In some studies, this was a main effect. In other studies, it was a post-hoc test following an interaction effect. The exact p-values were converted into t-values and t-values were converted into fisher-z scores as effect sizes. Sampling error was based on the sample size of the study or the subgroup in which the ease of retrieval effect was predicted. For the sake of comparability, I again show unweighted and weighted results.
The effect size estimate for the random effects model that ignores publication bias is z = .340, 95%CI = .317 to .363. This would be a moderate effect size (d ~ .6). The model also shows a moderate amount of heterogeneity, I2 = 33.48%. Adding sampling error as a predictor dramatically changes the results. The effect size estimate is now practically zero, z = .020. and the 95%CI is small enough to conclude that any effect would be small, 95%CI = -.048 to .088. Moreover, publication bias fully explains heterogeneity, I2 = 0.00%. Based on this finding, it is not recommended to use the variance as a predictor (Stanley, 2017). However, for the sake of comparison, Figure 1 also shows the results for this model. The red curve shows that the model makes similar predictions in the middle, but overestimates effect sizes for large samples and for small samples. Thus, the intercept is not a reasonable estimate of the average effect size, z = .183, 95%CI = .144 to .222. In conclusion, the new coding shows clearer evidence of publication bias and even the unweighted analysis shows no evidence that the average effect size differs from zero.
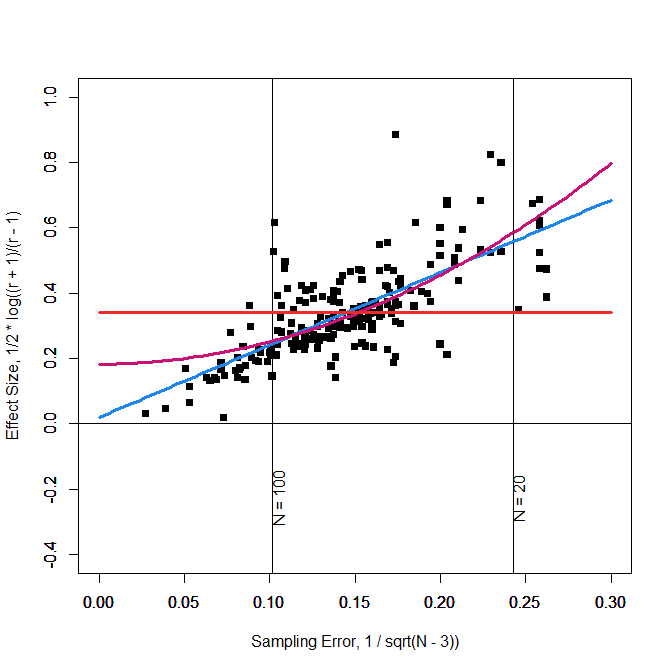
Figure 4 shows that the weighted models produce very similar results to the unweighted results.

The key finding is that the intercept is not significantly different from zero, z = -.016, 95%CI = -.053 to .022. The upper bound of the 95%CI corresponds to an effect size of r = .022 or d = .04. Thus, the typical ease of retrieval effect is practically zero and there is no evidence of heterogeneity.
Individual Studies
Meta-analysis treats individual studies as interchangeable tests of a single hypothesis. This makes sense when all studies are more or less direct replications of the same experiments. However, meta-analysis in psychology often combine studies that vary in important details such as the population (adults vs. children) and the dependent variables (frequency judgments vs. attitudes). Even if a meta-analysis would show a significant average effect size, it remains unclear which particular conditions show the effect and which ones do not. This is typically examined in moderator analyses, but when publication bias is strong and effect sizes are dramatically inflated, moderator analyses have low power to detect signals in the noise.
In Figure 4, real moderators would produce systematic deviations from the blue regression line. As these residuals are small and strongly influenced by sampling error, finding a moderator is like looking for a needle in a heystack. To do so, it is useful to look for individual studies that produced more credible results than the average study. A new tool that can be used for this purpose is z-curve (Bartos & Schimmack, 2021; Brunner & Schimmack, 2020).
Z-curve does not decompose p-values into separate effect size and sampling error components. Rather it converts p-values into z-scores and models the distribution of z-scores with a finite mixture model. The results provide complementary information about publication bias that does not rely on variation in sample sizes. As correlations between sampling error and effect sizes can be produced by other factors, z-curve provides a more direct test of publication bias.
Z-curve also provides information about the false positive risk in individual studies. If a literature has a low discovery rate (many studies produce non-significant results), the false discovery risk is high (Soric, 1989). Z-curve estimates the size of the file drawer and provides a corrected estimate of the expected discovery rate. To illustrate z-curve, I fitted z-curve to the ease-of-retrieval studies in the new meta-analysis (Figure 5).

Visual inspection shows that most z-statistics are just above the criterion for statistical significance z = 1.96. This corresponds to the finding that most effect sizes are about 2 times the magnitude of sampling error, which produces a just significant result. The z-curve shows a rapid decline of z-statistics as z-values increase. The z-curve model uses the shape of this distribution to estimate the expected discovery rate; that is, the proportion of significant results that are observed if all tests that were conducted were available. The estimate of 8% implies that most ease-of-retrieval tests are extremely underpowered and can only produce significant results with the help of sampling error. Thus, most of the observed effect size estimates in Figure 4 reflect sampling error rather than any population effect sizes.
The expected discovery rate can be compared to the observed discovery rate to assess the amount of publication bias. The observed discovery rate is simply the percentage of significant results for the 128 studies. The observed discovery rate is 83% and would be even higher if marginally significant results, p < .10, z > 1.65, were counted as significant. Thus, the observed discovery rate is 10 times higher than the expected discovery rate. This shows massive publication bias.
The difference between the expected and observed discovery rate is also important for the assessment of the false positive risk. As Soric (1989) showed, the risk of false positives increases as the discovery risk decreases. The observed discovery rate of 83% implies that the false positive risk is very small (1%). Thus, readers of journals are given the illusion that ease-of-retrieval effects are robust and researchers have a very good understanding of the conditions that can produce the effect. Hence, Kahneman’s praise of researchers’ ability to show the effect and to reverse it seemingly at will. The z-curve results show that this is an illusion because researchers only publish results when a study was successful. With an expected discovery rate of 8%, the false discovery risk is 61%. Thus, there is a high chance that studies with large samples will produce effect size estimates close to zero. This is consistent with the effect size estimates close to zero.
One solution to reduce the false-positive risk is to lower the significance criterion (Benjamin et al., 2017). Z-curve can be fitted with different alpha-levels to examine the influence on the false positive risk. By setting alpha to .005, the false positive risk is below 5% (Figure 6).

This leaves 36 studies that may have produced a real effect. A true positive result does not mean that a direct replication study will produce a significant result. To estimate replicability, we can select only the studies with p < .005 (z > 2.8) and fit z-curve to these studies using the standard significance criterion of .05. The false discovery risk inched up a bit, but may be considered acceptable with 8%. However, the expected replication rate with the same sample sizes is only 47%. Thus, replication studies need to increase sample sizes to avoid false negative results.

Five of the studies with strong evidence are by Sanna and colleagues. This is noteworthy because Sanna retracted 8 articles, including an article with ease-of-retrieval effects under suspicion of fraud (Yong, 2012). It is therefore unlikely that these studies provide credible evidence for ease-of-retrieval effects.
An article with three studies reported consistently strong evidence (Ofir et al., 2008). All studies manipulated the ease of recall of products and found that recalling a few low priced items made participants rate a store as less expensive than recalling many low priced items. It seems simple enough to replicate this study to test the hypothesis that ease of retrieval effects influence judgments of stores. Ease of retrieval may have a stronger influence for these judgments because participants may have less chronically accessible and stable information to make these judgments. In contrast, assertiveness judgments may be harder to move because people have highly stable self-concepts that show very little situational variance (Eid & Diener, 2004; Anusic & Schimmack, 2016).
Another article that provided three studies examined willingness to pay for trips to England (Sinha & Naykankuppam, 2013). A major difference to other studies was that this study supplied participants with information about tourist destinations in England and after a delay used recall of this information to manipulate ease of retrieval. Once more, ease-of-retrieval may have had an effect in these studies because participants had little chronically accessible information to make willingness-to-pay judgments.
A third, three study article with strong evidence found that participants rated the quality of their memory for specific events (e.g., New Year’s Eve) worse when they were asked to recall many (vs. few) facts about the event (Echterhoff & Hirst, 2006). These results suggest that ease-of-retrieval is used for judgments about memory, but may not influence other judgments.
The focus on individual studies shows why moderator analyses in effect-size meta-analysis often produce non-significant results. Most of the moderators that can be coded are not relevant, whereas moderators that are relevant can be limited to a single article and are not coded.
The Original Paradigm
It is not clear why Schwarz et al. (1991) decided to manipulate personality ratings of assertiveness. A look into the personality literature suggests that these judgments are often made quickly and with high temporal stability. Thus, they seemed a challenging target to demonstrate the influence of situational effects.
It was also risky to conduct these studies with small sample sizes that require large effect sizes to produce significant results. Nevertheless, the first study with 36 participants produced an encouraging, marginally significant result, F(1,34) = .07. Study 2 followed up on this result with a larger sample to boost power and did produce a real significant result, F(1, 142) = 6.35, p = .01. However, observed power (70%)) was still below the recommended level of 80%. Thus, the logical next step would have been to test the effect again with an even larger sample. However, the authors tested a moderator hypothesis in a smaller sample, which surprisingly produced a significant three-way interaction, F(1, 70) = 9.75, p < .001. Despite this strong interaction, the predicted ease-of-retrieval effects were not statistically significant because sample sizes were very small, assertive: t(18) = 1.55, p = .14, unassertive: t(18) = 1.91, p = .07.
It is unlikely to obtain supportive evidence in three underpowered studies (Schimmack, 2012), suggesting that the reported results were selected from a larger set of tests. This hypothesis can be tested with the Test of Insufficient Variance (TIVA), a bias test for small sets of studies (Renkewitz & Keiner, 2019; Schimmack, 2015). TIVA shows that the variation in p-values is less than expected, but the evidence is not conclusive. Nevertheless, even if the authors were just lucky, future studies are expected to produce non-significant results unless sample sizes are increased considerably. However, most direct replication studies of the original design used equally small sample sizes, but reported successful outcomes.
Yahalom and Schul (2016) reported a successful replication in another small sample (N = 20), with an inflated effect size estimate, t(18) = 2.58, p < .05, d = 1.15. Rather than showing the robustness of the effect, it strengthens the evidence that bias is present, TIVA p = .05. Another study in the same article finds evidence for the effect again, but only when participants are instructed to hear some background noise and not when they are instructed to listen to background noise, t(25) = 2.99, p = .006. The bias test remains significant, TIVA p = .05. Kuehnen did not find the effect, but claimed an interaction with item-order for questions about ease-of-retrieval and assertiveness. A non-significant trend emerged when ease-of-retrieval questions were asked first, which was not reported, t(34) = 1.10, p = .28. The bias test remains significant, TIVA p = .08. More evidence from small samples comes from Caruso (2008). In Study 1a, 30 participants showed an ease-of-retrieval effect, F(1,56) = 6.91, p = .011. The bias test remains significant, TIVA p = .06. Study 1b with more participants (N = 55), the effect was not significant, F(1, 110) = 1.05, p = .310. The bias test remains significant despite the non-significant result, TIVA p = .08. Tomala et al. (2007) added another just significant result with 79 participants, t(72) = 1.97, p = .05. This only strengthens the evidence of bias, TIVA p = .05. Yahalom and Schul (2013) also found a just significant effect with 130 students, t(124) = 2.54, only to strengthen evidence of bias, TIVA p = .04. Study 2 reduced the number of participants to 40, yet reported a significant result, F(1,76) = 8.26, p = .005. Although this p-value nearly reached the .005 level, there is no theoretical explanation why this particular direct replication of the original finding should have produced a real effect. Evidence for bias remains significant, TIVA p = .05. Study 3 reverts back to a marginally significant result that only strengthens evidence of bias, t(114) = 1.92, p = .06, TIVA bias p = .02. Greifeneder and Bless (2007) manipulated cognitive load and found the predicted trend only in the low-load condition, t(76) = 1.36, p = .18. Evidence for bias remained unchanged, TIVA p = .02.
In conclusion, from 1991 to 2016 published studies appeared to replicate the original findings, but this evidence is not credible because there is evidence of publication bias. Not a single one of these studies produced a p-value below .005, which has been suggested as a significance level that keeps the type-I error rate at an acceptable level (Benjamin et al., 2017).
Even meta-analyses of these small studies that correct for bias are inconclusive because sampling error is large and effect size estimates are imprecise. The only way to provide strong and credible evidence is to conduct a transparent and ideally pre-registered replication study with a large sample. One study like this was published by Yeager et al. (2019). With N = 1,325 participants the study failed to show a significant effect, F(1, 1323) = 1.31, p = .25. Groncki et al. (2021) conducted the first pre-registered replication study with N = 659 participants. They also ended up with a non-significant result, F(1, 657) = 1.34, p = .25.
These replication failures are only surprising if the inflated observed discovery rate is used to predict the outcome of future studies. Accordingly, we would have an 80% probability to get significant results and an even higher probability given the larger sample sizes. However, when we take publication bias into account, the expected discovery rate is only 8% and even large sample sizes will not produce significant results if the true effect size is close to zero.
In conclusion, the clear evidence of bias and the replication failures in two large replication studies suggest that the original findings were only obtained with luck or with questionable research practices. However, naive interpretation of these results created a literature with over 200 published studies without a real effect. In this regard, ease of retrieval is akin to the ego-depletion literature that is now widely considered invalid (Inzlicht, Werner, Briskin, & Roberts, 2021).
Discussion
2011 has been a watershed moment in the history of social psychology. It has split social psychology into two camps. One camp denies that questionable research practices undermine the validity of published results and continue to rely on published studies as credible empirical evidence (Schwarz & Strack, 2016). The other camp assumes that most published results are false positives and trusts only new studies that are published following open science practices with badges for sharing of materials, data, and ideally pre-registration.
Meta-analysis can help to find a middle ground by examining carefully whether published results can be trusted, even if some publication bias is present. To do so, meta-analysis have to take publication bias seriously. Given the widespread use of questionable practices in social psychology, we have to assume that bias is present (Schimmack, 2020). Published meta-analyses that did not properly correct for publication bias can at best provide an upper limit for effect sizes, but they cannot establish that an effect exists or that the effect size has practical significance.
Weingarten and Hutchinson (2018) tried to correct for publication bias by using the PET-PEESE approach (Stanley, 2017). This is currently the best bias-correction method, but it is by no means perfect (Hong & Reed, 2021; Stanley, 2017). Here I demonstrated one pitfall in the use of PET-PEESE. Coding of studies that does not match the bias in the original articles can obscure the amount of bias and lead to inflated effect size estimates, especially if the PET model is incorrectly rejected and the PEESE results are accepted at face value. As a result, the published effect size of r = .2 (d = .4) was dramatically inflated and new results suggest that the effect size is close to zero.
I also showed in a z-curve analysis that the false positive risk for published ease-of-retrieval studies is high because the expected discovery rate is low and the file drawer of unpublished studies is large. To reduce the false positive risk, I recommend to adjust the significance level to alpha = .005, which is also consistent with other calls for more stringent criteria to claim discoveries (Benjamin et al., 2017). Based on this criterion, neither the original studies, nor any direct replication s of the original studies were significant. A few variations of the paradigm may have produced real effects, but pre-registered replication studies are needed to examine this question. For now, ease of retrieval is a theory without credible evidence.
For many social psychologists, these results are shocking and hard to believe. However, the results are by no means unique to the ease-of-retrieval literature. It has been estimated that only 25% to 50% of published results in social psychology can be replicated (Schimmack, 2020). Other large literatures such as implicit priming, ego-depletion, and facial feedback have also been questioned by rigorous meta-analyses and large replication studies.
For methodologists the replication crisis in psychology is not a surprise. They have warned for decades that selection for significance renders significant results insignificant (Sterling, 1961) and that sample sizes are too low (Cohen, 1961). To avoid similar mistakes in the future, researchers should conduct continuous power analyses and bias tests. As demonstrated here for the assertiveness paradigm, bias tests ring the alarm bells from the start and continue to show bias. In the future, we do not need to wait 40 years before we realize that researchers are chasing an elusive phenomenon. Sample sizes need to be increased or research needs to stop. Amassing a literature of 200 studies with a median sample size of N = 53 and 8% power has to be a mistake that should not be repeated.
Social psychologists should be the least surprised that they fooled themselves in believing their results. After all, they have demonstrated with credible studies that confirmation bias has a strong influence on human information processing. They should therefore embrace the need for open science, bias-checks, and replication studies as necessary evils that are necessary to minimize confirmation bias and to make scientific progress.
References
Viechtbauer, W. (2010). Conducting meta-analyses in R with the metafor package. Journal of Statistical Software, 36(3), 1–48. https://www.jstatsoft.org/v036/i03.