Over the past decade it has become apparent that psychological science is not yet a real science. Too often a single article with inconclusive results is widely cited as evidence. One reason for this is the limited amount of journal space in traditional, tree-killing journals that made it difficult to publish replication studies. This is changing as it is becoming easier to share scientific research in online only journals, pre-prints, or blog posts.
In an influential article, Diener (1984) proposed a distinction between bottom-up models and top-down models of subjective well-being. Although the terms top-down and bottom-up are used to distinguish a variety of models, the terms have been used to compare two alternative models of the relationship between life-satisfaction and domain satisfaction judgments.
The top-down model assumes that life-satisfaction has a global halo effect on satisfaction with specific life domains. In contrast, bottom-up model consider life-satisfaction judgments to be summary judgments of satisfaction with important life domains (Schimmack, Diener, & Oishi, 2002).
An influential article in Psychological Bulletin used meta-analytic correlations to test these two models against each other (Heller, Watson, & Ilies, 2004). The article has been cited over 300 times, but a review of these articles did not reveal a single replication study.
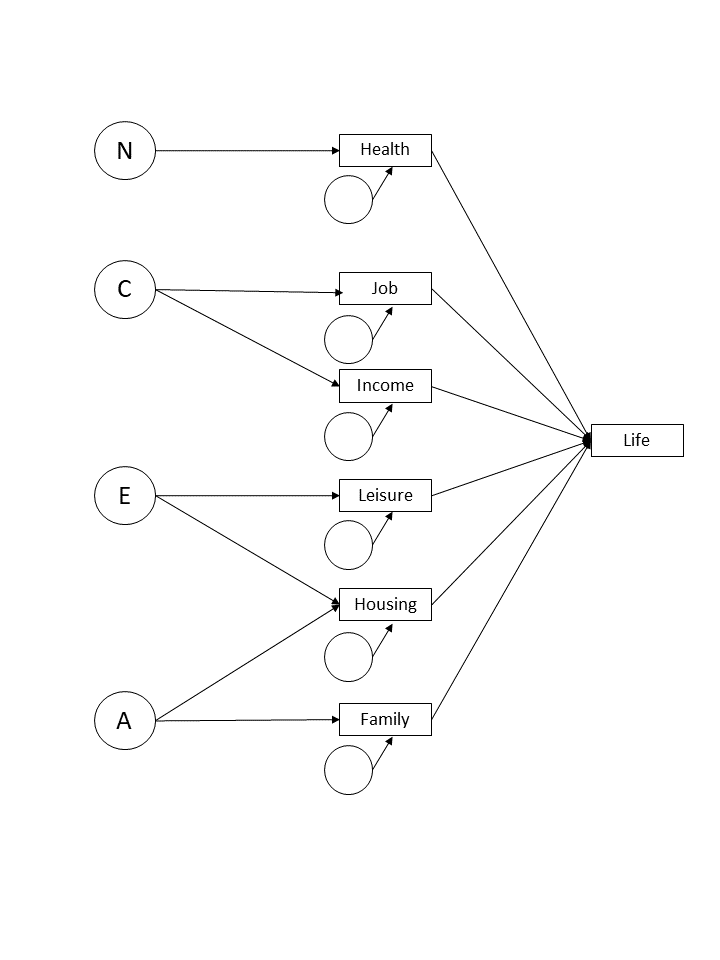
To compare top-down and bottom-up models, Heller et al. (2004) included personality measures of the Big Five. The bottom-up model assumes that personality traits influence specific life domains (e.g., neuroticism influences health satisfaction, extraversion influences leisure satisfaction), and that domain satisfaction mediates the influence of personality on life-satisfaction (Figure 1).
The alternative top-down model assumes that personality traits influence life-satisfaction and that life-satisfaction mediates effects of personality on life domains (Figure 2).

There are two major differences between these models. First, the bottom-up model allows for life-circumstances to influence life-satisfaction. For example, actual income could influence income satisfaction, which is supported by studies that show moderate to strong correlations between income and financial satisfaction. In Figure 1, income and other life-circumstances are represented by the residual variances of domain satisfaction that are not due to personality traits. These residual variances are often omitted from figures because there is a common misperception to think about residual variances as error variances, which is only true in measurement models where residual variance may reflect only random error. This is not the case here. While domain satisfaction residuals contain some random and systematic measurement error, they also reflect actual life-circustances and person x situation interaction effects that produce real variation in domain satisfaction. Figure 1 shows that these residuals have an influence on life-satisfaction because there is an arrow from the residuals to the domain satisfactions (e.g., income to income satisfaction) and from the domain to life-satisfaction (income-satisfaction to life-satisfaction). It would be possible to add manifest measures of these life-circumstances to the model, but if no measures are available, the variance is reflected in latent variables that capture the influence of unmeasured causes on domain satisfaction. Figure 2 shows that there is no path from the domain-satisfaction residuals to life-satisfaction. Thus, Heller et al.’s top-down model implies that actual life-circustances like income have no influence on life-satisfaction or that these effects are so small that they can be safely ignored.
The second difference between the models is that Figure 2 implies that personality traits that influence life-satisfaction also influence all life domains. The rational is that the halo from life extends to all aspects of life. In contrast, the bottom-up model in Figure 1 does not make this assumption. It is possible that all personality traits influence all life domains (cf. Heller et al., 2004), but it is also possible that some personality traits are only beneficial for some domains. For example, McCrae and Costa (1991) speculated that agreeableness is beneficial for love (family satisfaction), whereas conscientiousness is beneficial for work (job & income).
It is noteworthy that Heller et al. (2004) found better fit for the bottom-up model than the top-down model, CFI = 1.00 vs. .96, RMSEA = .01 vs. .08, but favored the top-down model because it is more parsimonious. This decision is questionable because CFI and RMSEA do take parsimony into account and still favor the bottom-up model. The preference of the top-down model may also be explained by review articles that suggested objective life-circumstances are relatively unimportant for life-satisfaction (Diener, 1984; Diener, Suh, Lucas, & Smith, 1999). However, over the past two decades, new research has demonstrated that life-events are more important than researchers originally assumed (Diener, Lucas, & Scollon, 2006; Schimmack, Schupp, & Wagner, 2008).
My literature review of studies that cited Heller et al. (2004) retrieved one important article that deserves attention (Lachmann et al., 2018).

The article reports four highly similar studies that examined the correlations among the Big Five dimensions, 5 or 6 domain satisfaction judgments, and global life-satisfaction judgments. Study 1 had a sample size of 29,418 participants. Study 2 replicated Study 1 with 4390 participants. The main limitation of Studies 1 and 2 was the use of a very brief personality questionnaire (i.e., the 10-item BFI-10). Studies 3 and 4 had smaller sample sizes (Ns = 496, 488), but used the longer NEO-FFI to measure personality. Study 3 and 4 were based on German and Chinese student samples, respectively. This made it possible to examine cultural similarities and differences. The main finding of this study was that domain satisfaction judgments explained additional variance in life-satisfaction judgments that was not explained by personality. This finding favors bottom-up models. The main limitation of this article was that the authors did not fit bottom-up and top-down models to the data, but they reported the correlation matrices and standard deviations, which makes it possible to fit these models to their data. Here I report the results of these analyses.
Studies 1 and 2
One major problem in mono-method studies is that self-ratings of personality and life-satisfaction share rater biases (Diener, 1984; Schimmack et al., 2008). Anusic et al. (2009) found a way to model this rater bias with a method factor that they called halo factor. It is possible to fit a halo factor to self-ratings of the Big Five because the actual personality traits are fairly independent. Thus, any correlations among self-ratings of the Big Five reflect mostly halo bias, although some additional relationships may exist. The same halo factor can also influence ratings of domain satisfaction and life-satisfaction. Thus, one solution to control for method variance in self-ratings is to let all measures (personality, domain satisfaction, life-satisfaction) to load on a single factor and to use the residuals to model the actual structural relationships (Schimmack et al., 2008). This is the approach I used here. Figure 3 illustrates this measurement approach.

H represents the halo factor that produces shared method variance among all measures. N’, A’, he’, fa’ and ls’ represents the remaining variance in these measures after controlling for the shared method variance. The actual structural model is then created by relating these residuals to each other. Figure 3 illustrates this with a sparse bottom-up model that assumes only N and A influence life-satisfaction and that these effects are fully mediated by health satisfaction and family satisfaction, respectively. Figure 3 is only used to illustrate the measurement model. The actual model was more complex, but difficult to represent graphically.
To easy model identification, I first constrained the unstandardized loading of all Big Five dimensions on the halo factor to 1. I allowed the remaining loadings to vary freely. The bottom-up model allowed for N, E, A, and C to influence all domains and all domains could influence life-satisfaction. This is identical to Heller’s model. Also, I allowed domain satisfaction residuals to correlate because life domains can overlap (e.g., income satisfaction can be correlated with job satisfaction).
Inspection of the modification indices suggests that BFI-10 Extraversion is related to BFI-10 Neuroticism. Therefore, I allowed for an extra relationship between the residuals of E and N (N’ with E’). The bottom-up model had good fit, CFI = .988, RMSEA = .042, and had better fit than the top-down model, CFI = .947, RMSEA = .054. Even the Bayesian Information Criterion that rewards parsimony the most, favored the more complex bottom=up model, BIC = 1,122,010 vs. 1,123,937. This result replicates Heller et al.’s (2004) finding, although they favored the top-down model, and the results confirm Lachmann et al.’s conclusions based on the same data.
Given the large sample size, it is better to focus on effect sizes. The parameter estimates for the bottom-up model showed notable (effect size r > .1) effects of neuroticism on health satisfaction (-.28), job satisfaction (-.20), income satisfaction (-.13), housing satisfaction (-.24), and leisure satisfaction (-.12). That is, all domains were negatively related to neuroticism. Extraversion had positive relationships with health satisfaction (.21), job satisfaction (.15), housing satisfaction (.23), and leisure satisfaction (.14). The effect for income satisfaction (.08) was close to .10. Thus, extraversion also showed broad relationships with most if not all domains. Conscientiousness showed notable effects for job satisfaction (.16), income satisfaction (.12), but not for housing satisfaction (.01) or leisure satisfaction (.05). The effect for health was close to .10 (.08). Agreeableness did not show any notable relationships. The strongest effect was for health satisfaction (.07).
Table 1 shows the unique effects of the domains on life-satisfaction. All of these effects are significant well beyond the conservative 5-sigma criterion used in particle physics (zs > 11). The reason the effect sizes are small is that life is a complex object with many domains. Thus, any single domain can only explain a small portion of the variance in life-satisfaction. In addition, life domains overlap and regression coefficients reveal only the unique variance that is explained by a single domain. Together, these five domains explained 56% of the variance in life-satisfaction, which is close to the amount of reliable variance in a single-item measure of life-satisfaction (Schimmack & Oishi, 2005).

A bottom up model assumes that personality effects on life-satifaction are mediated by life-domains. I used the model indirect function to get estimates of the indirect effects of personality traits on life-satisfaction. The results are consistent with the common finding that neuroticism and extraversion are the strongest predictors of life-satisfaction (Heller et al., 2004). After controlling for shared method variance, the remaining traits explain relatively small amounts of variance in life-satisfaction judgments (Schimmack et al., 2008; Schimmack & Kim, 2020). Even if these traits had some strong effects on some domains, the effect on life-satisfaction would be muted by the small effects of single domains on life-satisfaction. Extraversion and neuroticism have stronger effects on life-satisfaction because they influence a broad range of domains. The effect size for neuroticism in this study may be attenuated by the lower reliability of the 2-item measure in the BFI-10.

Study 2 is an exact replication of Study 1 with a new sample. The bottom-up model fit the data better than the top-down model, CFI = .993 vs. .975, RMSEA = .035 vs. 041, BIC = 170,443 vs. 170,471.
Neuroticism was a notable (effect size r > .1), predictor of health satisfaction (-.15), job satisfaction (-.12) and leisure satisfaction (-.14). This time, the effects for income satisfaction (-.08) and housing satisfaction (-.08) were slightly below the cutoff. Extraversion only reached the cutoff value for leisure (.11). Conscientiousness once again predicted job satisfaction (.12) and income satisfaction (.14). Once again, agreeableness was not a notable predictor of any life domain.
Table 3 shows that the contribution of domains to life-satisfaction was also similar across studies. Once more job was the weakest predictor and leisure was the strongest predictor. Despite the smaller sample size, all effects are significant with sigma-5 as criterion (zs > 8).

Neuroticism was again the strongest predictor and agreeableness and conscientiousness were again weak predictors of life-satisfaction.

The most notable difference to the first study is that extraversion was a weak predictor in this study, which was also reflected in the weak relationships with domain satisfaction. A large investigation of possible moderators shows that this finding is not due to the reliance on a German sample, although extraversion effects in Germany may be a little bit weaker than in North American samples. Given the use of a two-item Extraversion measure these results should not be overinterpreted.
The main finding from Studies 1 and 2 is that the bottom-up model fits the data better than the top-down model and that one reason for this better fit is that unique variance in life domains contributes to overall judgments of life-satisfaction. Figure 4 summarizes the main findings.

Studies 3 and 4
Samples 3 and 4 were analyzed simultaneously with a multiple group model to compare cultural differences between German and Chinese samples. Studies 3 and 4 also added family satisfaction as a life domain and used the longer NEO-FFI to measure personality.
The bottom-up model fitted the data better than the top-down model for the CFI, .973 vs. .933, and RMSEA = .045 vs. .063, but not for BIC = 37,357 vs. 37345. The reason is that BIC is sensitive to sample sizes and treats small effects in small samples as consistent with null-effects. In fact, the sample size adjusted BIC preferred the bottom-up model, 37,087 vs. 37,138.
The personality effects on domain satisfaction were once again weak, except for neuroticism. The only notable difference between cultures was a stronger relationship between conscientiousness and health satisfaction in the Chinese sample (.16 vs. 01).

All domains except job satisfaction contributed to overall life-satisfaction. Results were similar across the two cultural samples.

The reason for the different results for job satisfaction could be that these were student samples and they rated satisfaction with their courses.

The indirect effects of personality are again weak, but neuroticism is the strongest predictor because it influences most if not all domains.
Conclusion
Heller et al. (2004) argued for top-down models of subjective well-being. The main assumption of these models is that well-being is strongly influenced by personality traits and that actual life-circumstances have no influence on SWB. Even Heller et al.’s (2004) data did not favor this model, but it fitted trait-theories of well-being that were popular in the 1980s and 1990s. Although well-being researchers have moved on from trait or set-point theories (Diener et al., 2006), old articles are still cited although they are inconsistent with new data as well as the old data. It is time to abandon top-down models that never made sense and never fit actual data and start building on models that are actually consistent with the data. Any scientific model of well-being has to acknowledge that well-being is less stable than personality traits (Anusic & Schimmack, 2016) and more strongly influenced by life events and environmental factors than personality traits (Diener et al., 2006).
The neglect of bottom-up models has had several negative consequences on personality and well-being research. Most importantly, researchers have neglected to study the influence of personality on specific life domains. The present results suggest that only neuroticism appears to have a pervasive influence on many life domains, whereas other personality traits may only affect some life domains. It is also possible that personality traits interact with environmental factors in the prediction of domain satisfactions. A focus on global life-satisfaction judgments is problematic because life-satisfaction is a broad aggregate of many factors. As a result, effect sizes for any specific factor are bound to be weak. Exploration of domain satisfaction in smaller studies may elict new factors that have been overlooked in studies with global life-satisfaction judgments.
Another problem for well-being researchers is the assumption that global life-satisfaction judgments are unbiased measures of subjective well-being. That is, the prevailing assumption is that respondents weigh relevant information according to their subjective importance. However, this may not be the case. While I have found some evidence that accessibility is related to importance (Schimmack et al., 2002), many other factors can influence what information respondents use to answer vague, global life-satisfaction judgments. For example, while the present study found that health satisfaction contributed unique information, another study failed to find effects of health satisfaction (Payne & Schimmack, in press). More studies with the bottom-up model are needed to examine the contribution of domains to life-satisfaction judgments and to examine potential moderators of these relationships.
In conclusion, although top-down models are not supported by empirical evidence, well-being and personality researchers have been slow to adopt bottom-up models that recognize the importance of life circumstances for well-being. Although personality is important, well-being is not a stable trait and well-being is more than a disposition to look to the bright side of life. A complete understanding of well-being requires an integrated model of environmental and personality factors. The bottom-up model is a first step in that direction.
When looking at models that include a halo factor without including multiple informants, I always worry they’re overfitting. Like we know bifactor models tend to overfit. Obviously in a sense since we know halo exists, it’s more correct to model it than not to model it. But it’s kind of disturbing that almost all of this research is done with only self-reports so one has to hack in the halo factor like this.
(Somewhat tangential – you wouldn’t happen to know some good place to get reports from 3+ informants for data? For practical reasons I can’t ask my participants to bring in someone else to rate them. The best I’ve come up with so far is that I could recruit couples on Prolific and have them rate their SOs, but that only yields two informants per person… This seems like a pretty major gap in research…)
The ability to model halo with just self-ratings comes from the evidence from mutli-rater studies that the Big Five are largely independent. That makes it possible to model correlations among the Big Five as method variance.
Nevertheless, I agree that it would be superior to show this with multi-method data and we are working on a publication that does just that.
The problem is that very few psychologists care about domain satisfaction and I am only aware of one dataset (my own) that has multi-rater data on domain satisfaction.