
Over the past years, psychologists have become increasingly concerned about the credibility of published results. The credibility crisis started in 2011, when Bem published incredible results that seemed to suggest that humans can foresee random future events. Bem’s article revealed fundamental flaws in the way psychologists conduct research. The main problem is that psychology journals only publish statistically significant results (Sterling, 1959). If only significant results are published, all hypotheses will receive empirical support as long as they are tested. This is akin to saying that everybody has a 100% free throw average or nobody ever makes a mistake if we do not count failures.
The main problem of selection for significance is that we do not know the real strength of evidence that empirical studies provide. Maybe the selection effect is small and most studies would replicate. However, it is also possible that many studies might fail a replication test. Thus, the crisis of confidence is a crisis of uncertainty.
The Open Science Collaboration conducted actual replication studies to estimate the replicability of psychological science. They replicated 97 studies with statistically significant results and were able to reproduce 35 significant results (a 36% success rate). This is a shockingly low success rate. Based on this finding, most published results cannot be trusted, especially because there is heterogeneity across studies. Some studies would have an even lower chance of replication and several studies might even be outright false positives (there is actually no real effect).
As important as this project was to reveal major problems with the research culture in psychological science, there are also some limitations that cast doubt about the 36% estimate as a valid estimate of the replicability of psychological science. First, the sample size is small and sampling error alone might have lead to an underestimation of the replicability in the population of studies. However, sampling error could also have produced a positive bias. Another problem is that most of the studies focused on social psychology and that replicability in social psychology could be lower than in other fields. In fact, a moderator analysis suggested that the replication rate in cognitive psychology is 50%, while the replication rate in social psychology is only 25%. The replicated studies were also limited to a single year (2008) and three journals. It is possible that the replication rate has increased since 2008 or could be higher in other journals. Finally, there have been concerns about the quality of some of the replication studies. These limitations do not undermine the importance of the project, but they do imply that the 36% estimate is an estimate and that it may underestimate the replicability of psychological science.
Over the past years, I have been working on an alternative approach to estimate the replicability of psychological science. This approach starts with the simple fact that replicabiliity is tightly connected to the statistical power of a study because statistical power determines the long-run probability of producing significant results (Cohen, 1988). Thus, estimating statistical power provides valuable information about replicability. Cohen (1962) conducted a seminal study of statistical power in social psychology. He found that the average power to detect an average effect size was around 50%. This is the first estimate of replicability of psychological science, although it was only based on one journal and limited to social psychology. However, subsequent studies replicated Cohen’s findings and found similar results over time and across journals (Sedlmeier & Gigerenzer, 1989). It is noteworthy that the 36% estimate from the OSC project is not statistically different from Cohen’s estimate of 50%. Thus, there is convergent evidence that replicability in social psychology is around 50%.
In collaboration with Jerry Brunner, I have developed a new method that can estimate mean power for a set of studies that are selected for significance and that vary in effect sizes and samples sizes, which produces heterogeneity in power (Brunner & Schimmack, 2018). The input for this method are the actual test statistics of significance tests (e.g., t-tests, F-tests). These test-statistics are first converted into two-tailed p-values and then converted into absolute z-scores. The magnitude of these absolute z-scores provides information about the strength of evidence against the null-hypotheses. The histogram of these z-scores, called a z-curve, is then used to fit a finite mixture model to the data that estimates mean power, while taking selection for significance intro account. Extensive simulation studies demonstrate that z-curve performs well and provides better estimates than alternative methods. Thus, z-curve is the method of choice for estimating the replicability of psychological science on the basis of the test statistics that are reported in original articles.
For this blog post, I am reporting results based on preliminary results from a large project that extracts focal hypothesis from a broad range of journals that cover all areas of psychology for the years 2010 to 2017. The hand-coding of these articles complements a similar project that relies on automatic extraction of test statistics (Schimmack, 2018).
Table 1 shows the journals that have been coded so far. It also shows the estimates based on the automated method and for hand-coding of focal hypotheses.
| Journal | Hand | Automated |
| Psychophysiology | 84 | 75 |
| Journal of Abnormal Psychology | 76 | 68 |
| Journal of Cross-Cultural Psychology | 73 | 77 |
| Journal of Research in Personality | 68 | 75 |
| J. Exp. Psych: Learning, Memory, & Cognition | 58 | 77 |
| Journal of Experimental Social Psychology | 55 | 62 |
| Infancy | 53 | 68 |
| Behavioral Neuroscience | 53 | 68 |
| Psychological Science | 52 | 66 |
| JPSP-Interpersonal Relations & Group Processes | 33 | 63 |
| JPSP-Attitudes and Social Cognition | 30 | 65 |
| Mean | 58 | 69 |
Hand coding of focal hypothesis produces lower estimates than the automated method because the automated analysis also codes manipulation checks and other highly significant results that are not theoretically important. The correlation between the two methods shows consistency across the two methods, r = .67. Finally, the mean for the automated method, 69%, is close to the mean for over 100 journals, 72%, suggesting that the sample of journals is an unbiased sample.
The hand coding results also confirm results found with the automated method that social psychology has a lower replicability than some other disciplines. Thus, the OSC reproducibility results that are largely based on social psychology should not be used to make claims about psychological science in general.
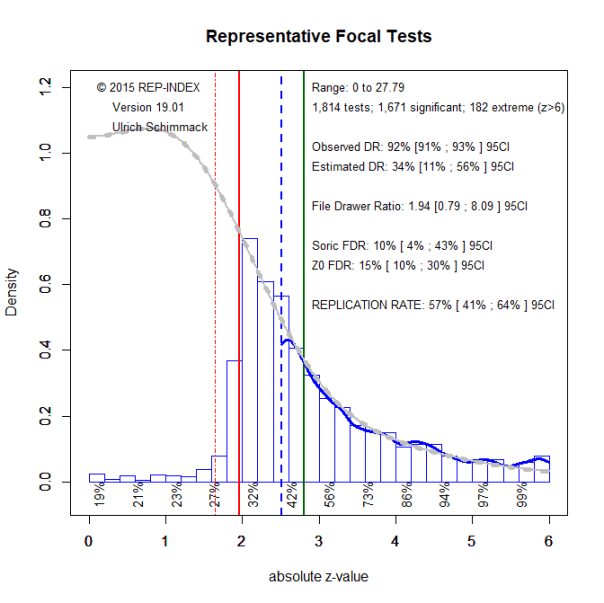
The figure below shows the output of the latest version of z-curve. The first finding is that the replicability estimate for all 1,671 focal tests is 56% with a relatively tight confidence interval ranging from 45% to 56%. ZZZ The next finding is that the discovery rate or success rate is 92%, using p < .05 as the criterion. This confirms that psychology journals continue to published results are selected for significance (Sterling, 1959). The histogram further shows that even more results would be significant if p-values below .10 are included as evidence for “marginal significance.”

Z-Curve.19.1 also provides an estimate of the size of the file drawer. It does so by projecting the distribution of observed significant results into the range of non-significant results (grey curve). The file drawer ratio shows that for every published result, we would expect roughly two unpublished studies with non-significant results. However, z-curve cannot distinguish between different questionable research practices. Rather than not disclosing failed studies researchers may not disclose other statistical analyses within a published study to report significant results.
Z-Curve.19.1 also provides an estimate of the false positive rate (FDR). FDR is the percentage of significant results that may arise from testing a true nil-hypothesis, where the population effect size is zero. For a long time, the consensus has been that false positives are rare because the nil-hypothesis is rarely true (Cohen, 1994). Consistent with this view, Soric’s estimate of the maximum false discovery rate is only 10% with a tight CI ranging from 8% to 16%.
However, the focus on the nil-hypothesis is misguided because it treats tiny deviations from zero as true hypotheses even if the effect size has no practical or theoretical significance. These effect sizes also lead to low power and replication failures. Therefore, Z-Curve 19.1 also provides an estimate of the FDR that treats studies with very low power as false positives. This broader definition of false positives raises the FDR estimate slightly, but 15% is still a low percentage. Thus, the modest replicability of results in psychological science is mostly due to low statistical power to detect true effects rather than a high number of false positive discoveries.
The reproducibility project showed that studies with low p-values were more likely to replicate. This relationship follows from the influence of statistical power on p-values and replication rates. To achieve a replication rate of 80%, p-values had to be less than .00005 or the z-score had to exceed 4 standard deviations. However, this estimate was based on a very small sample of studies. Z-Curve.19.1 also provides estimates of replicability for different levels of evidence. These values are shown below the x-axis. Consistent with the OSC results, a replication rate over 80% is only expected once z-scores are greater than 4.
The results also provide information about the choice of the alpha criterion to draw inferences from significance tests in psychology. To do so, it is important to distinguish observed p-values and type-I probabilities. For a single unbiased tests, we can infer from an observed p-value less than .05 that the risk of a false positive result is less than 5%. However, when multiple comparisons are made or results are selected for significance, an observed p-values less than .05 does not imply that the type-I error risk is below .05. To claim a type-I error risk of 5% or less, we have to correct the observed p-values, just like a Bonferroni correction. As 50% power corresponds to statistical significance, we see that z-scores between 2 and 3 are not statistically significant; that is, the type-I error risk is greater than 5%. Thus, the standard criterion to claim significance with alpha = .05 is a p-value of .003. Given the popularity of .005, I suggest to use p = .005 as a criterion for statistical significance. However, this claim is not based on lowering the criterion for statistical significance because p < .005 still only allows to claim that the type-I error probability is less than 5%. The need for a lower criterion value stems from the inflation of the type-I error rate due to selection for significance. This is a novel argument that has been overlooked in the significance wars, which ignored the influence of publication bias on false positive risks.
Finally, z-curve.19.1 makes it possible to examine the robustness of the estimates by using different selection criteria. One problem with selection models is that p-values just below .05, say in the .01 to .05 range, can arise from various questionable research practices that have different effects on replicability estimates. To address this problem, it is possible to estimate the density with a different selection criterion, while still estimating the replicability with alpha = .05 as the criterion. Figure 2 shows the results by using only z-scores greater than 2.5, p = .012) to fit the observed z-curve for z-scores greater than 2.5.
The blue dashed line at z = 2.5 shows the selection criterion. The grey curve between 1.96 and 2.5 is projected form the distribution for z-scores greater than 2.5. Results show a close fit with the observed distribution. A s a result, the parameter estimates are also very similar. Thus, the results are robust and the selection model seems to be reasonable.
Conclusion
Psychology is in a crisis of confidence about the credibility of published results. The fundamental problems are as old as psychology itself. Psychologists have conducted low powered studies and selected only studies that worked for decades (Cohen, 1962; Sterling, 1959). However, awareness of these problems has increased in recent years. Like many crises, the confidence crisis in psychology has created confusion. Psychologists are aware that there is a problem, but they do not know how large the problem is. Some psychologists believe that there is no crisis and pretend that most published results can be trusted. Others are worried that most published results are false positives. Meta-psychologists aim to reduce the confusion among psychologists by applying the scientific method to psychological science itself.
This blog post provided the most comprehensive assessment of the replicability of psychological science so far. The evidence is largely consistent with previous meta-psychological investigations. First, replicability is estimated to be slightly above 50%. However, replicability varies across discipline and the replicability of social psychology is below 50%. The fear that most published results are false positives is not supported by the data. Replicability increases with the strength of evidence against the null-hypothesis. If the p-value is below .00001, studies are likely to replicate. However, significant results with p-values above .005 should not be considered statistically significant with an alpha level of 5%, because selection for significance inflates the type-I error. Only studies with p < .005 can claim statistical significance with alpha = .05.
The correction for publication bias implies that researchers have to increase sample sizes to meet the more stringent p < .005 criterion. However, a better strategy is to preregister studies to ensure that reported results can be trusted. In this case, p-values below .05 are sufficient to demonstrate statistical significance with alpha = .05. Given the low prevalence of false positives in psychology, I do see no need to lower the alpha criterion.
Future Directions
This blog post is just an interim report. The final project requires hand-coding of a broader range of journals. Readers who think that estimating the replicability of psychological science is beneficial and who want information about a particular journal are invited to collaborate on this project and can obtain authorship if their contribution is substantial enough to warrant authorship. Please consider taking part in this project. Although it is a substantial time commitment, it doesn’t require participants or materials that are needed for actual replication studies. Please consider taking part in this project. Contact me, if you are interested and want to know how you can get involved.
Quote from above: “However, when multiple comparisons are made or results are selected for significance, an observed p-values less than .05 does not imply that the type-I error risk is below .05. To claim a type-I error risk of 5% or less, we have to correct the observed p-values, just like a Bonferroni correction. ”
I am worried that (large) existing data sets, and subsequent analyses using these existing data sets, might lead to a whole new way of 1) p-hacking, and 2) selective reporting.
I reason that p-hacking and selective reporting can/will still be done using (large) existing data sets, but it doesn’t seem like it at first glance. That’s because i reason the p-hacking and selective reporting happens by separate papers, by different researchers, and over a longer period of time.
Like i wrote below one of your previous blog posts (https://replicationindex.com/2019/03/17/raudit-bargh/#comment-17858) i wonder how researchers can control for multiple analyses by adjusting the p-value when they don’t know how many others are, or have been, analyzing the open data set they are currently working on? (p-hacking?).
And, what do you think the chances are that researchers will “explore” the data set in tons of different ways, and then consciously or unconsciously, only “pre-register” the analyses they are subsequently “confirming” in their to be written paper? (p-hacking? selective reporting?). And, what do you think the chances are that researchers will only write about “findings” they want to find, but not those they don’t want to find, when analyzing the open data set? (selective reporting?).
You make an interesting point. I would say that we can examine this (and corrected for it) using z-curve applied to data from the same dataset. However, the method has to be developed to allow for correlated tests.
I also think it is important to realize that p-hacking is more problematic with small datasets. When datasets are large and power is high, bias introduced by selection for significance is small.
Also, large datasets can focus on effect size estimation rather than testing directional hypotheses.
Thus, I am less concerned about large datasets. The key problem in psychology remains the single-lab mutliple-study approach to research.
Quote from above: “When datasets are large and power is high, bias introduced by selection for significance is small.”
Hmm, i am not sure i agree. I simply reason that the larger the data set (variables and/or participants), the higher the chance that spurious and/or non-informational results show up. I then reason that analysing existing large data sets make it very possible that selective reporting of these spurious and/or non-informational results can and will happen.
To further illustrate my point:
1) Here is a paper that shows Meehl’s “6th law of soft Psychology” by showing that everything correlates with everything: https://journals.sagepub.com/doi/10.2466/pr0.1991.69.1.123.
From the abstract: “Every one of the 135 variables, save ID number, displayed more statistically significant correlations with the other variables than could be predicted from chance. With alpha set at .05 (two-tailed), a given variable correlated significantly on average with 41% of the other variables, although the absolute magrutude of the correlations averaged only .07.”
2) Here you can practice your p-hacking skills using real data: https://projects.fivethirtyeight.com/p-hacking/
Now imagine this was a large “open data” set. And now imagine the possible scenarios i wrote above. I can totally see p-hacking and/or selective reporting happening all over the place. I really worry it’s similar to p-hacking, and selective reporting, as has happened in the last decades. With possibly one notable exception which i fear even makes it way worse: the studies that resulted in these large data sets, and the “findings” coming from them, can almost certainly never be replicated to verify matters!?
I truly think this should all be examined, and thought about, and discussed much more. In the link to my comment on one of your earlier posts, i provided some other thoughts and ideas that might be interesting to further ponder and/or test.
Thank you for your reply! Should you feel it might be worthwhile to investigate and/or discuss further with others i sincerely hope you will do that. You can also let me know if i should e-mail you or something like that to further make my thoughts clear should they not be. I should note though, i am not a statistician, and merely trying to reason about matters.
Your concerns are valid, but I like to distinguish between random and systematic error. P-hacking that capitalizes on random sampling error produces results that cannot be replicated. Systematic error, like Meehl’s crud produces errors that can be replicated. For example, halo bias produces very replicable correlations between Big Five and life-satisfaction. So, I like to make a distinction between the two problems. Others have blurred the distinction and called systematic and replicable bias false positives. I think it is better to keep the two separately.
Hi professor, I have an interest in contributing to this project. My field of research is evolutionary psychology, thank you.
Can you email me? ulrich.schimmack@utoronto.ca
Reproducibility is a defining feature of science, but the extent to which it characterizes current research is unknown. We conducted replications of 100 experimental and correlational studies published in three psychology journals using high-powered designs and original materials when available. Replication effects were half the magnitude of original effects, representing a substantial decline. Ninety-seven percent of original studies had statistically significant results. Thirty-six percent of replications had statistically significant results; 47% of original effect sizes were in the 95% confidence interval of the replication effect size; 39% of effects were subjectively rated to have replicated the original result; and if no bias in original results is assumed, combining original and replication results left 68% with statistically significant effects. Correlational tests suggest that replication success was better predicted by the strength of original evidence than by characteristics of the original and replication teams.