
Originally Posted: December 6, 2016
Revised Version with Z-curve plots: January 16, 2021
Diederik A. Stapel represents everything that has gone wrong in experimental social psychology. Until 2011, he was seen as a successful scientists who made important contributions to the literature on social priming.
In 2011, an investigation into Diedrik Stapel’s reserach practices revealed scientific fraud, which resulted in over 50 retractions (Retraction Watch), including the article on unconscious social comparisons (Retraction Notice). In a book, Diederik Stapel told his story about his motives and practices, but the book is not detailed enough to explain how particular datasets were fabricated. All we know, is that he used a number of different methods that range from making up datasets to the use of questionable research practices that increase the chance of producing a significant result. These practices are widely used and are not considered scientific fraud, although the end result is the same. Published results no longer provide credible empirical evidence for the claims made in a published article.
One retracted article is the article “From Seeing to Being: Subliminal Social Comparisons Affect Implicit and Explicit Self-Evaluations” by Stapel and Blaton (2004). The APA retraction notice claims that the data were considered to be fraudulent.

The report by the Noort Committee lists the following problems with the article.
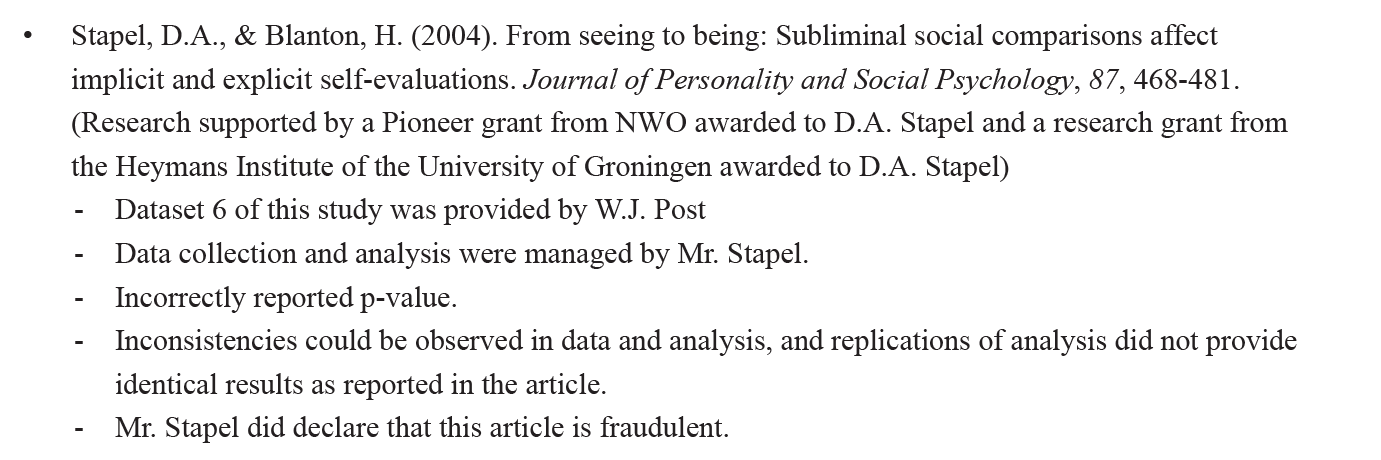
There is no indication or admission that the data were fabricated, which is often the way Stapel’s practices are described. Rather, the problem appears to be that data were collected, but deceptive research practices were used to present results that supported the main hypothesis. It is well known that these practices were common in social psychology and psychology in general. Thus, the only reason this article was retracted and other articles that used QRPs were not retracted was that Stapel declared these data to be fraudulent. It is therefore interesting to examine what these results look like and how they compare to other results that have been published and are not retracted.
A researcher who starts with real data and then uses questionable practices to get signifiance is likely to use as little dishonest practices as possible because this makes it easier to justify the questionable decisions. For example, removing 10% of data may seem justified, especially if some rational for exclusion can be found. However, removing 60% of data cannot be justified. The researcher will need to use these practices to produce the desired outcome, namely a p-value below .05 (or at least very close to .05). As more use of questionable practices is not needed and harder to justify, the researcher will stop producing stronger evidence. This should produce a disproportation number of p-values that are just significant.
I developed two statistical tests that detect the presence of too many just significant results. One test is the Replicability-Index (R-Index). The other one is the Test of Insufficient Variance (TIVA). I applied these tests to the focal statistical tests in the 8 studies. The table shows the key finding of each study.
| Study | Statistic | p | z | OP |
| 1 | F(1,28)=4.47 | 0.044 | 2.02 | 0.52 |
| 2A | F(1,38)=4.51 | 0.040 | 2.05 | 0.54 |
| 2B | F(1,32)=4.20 | 0.049 | 1.97 | 0.50 |
| 2C | F(1,38)=4.13 | 0.049 | 1.97 | 0.50 |
| 3 | F(1,42)=4.46 | 0.041 | 2.05 | 0.53 |
| 4 | F(2,49)=3.61 | 0.034 | 2.11 | 0.56 |
| 5 | F(1,29)=7.04 | 0.013 | 2.49 | 0.70 |
| 6 | F(1,55)=3.90 | 0.053 | 1.93 | 0.49 |
All results were interpreted as evidence for an effect and the p-value for Study 6 was reported as p = .05. Although the Noort commission highlights this misreporting of a p-value, it is common practice to report p = .053 as significant and many more articles would have to be retracted if this was not acceptable. However, a real p-value of .053 provides as much or as little evidence against the null-hypothesis as a real p-value of .047.
A much bigger problem that was not noticed by the Noort commission is that all the p-values are just signifcant. This is a highly improbable outcome of actual statistical results because sampling error produces high variability in p-values.
TIVA examines whether the observed variance in p-values is significantly lower than we would expect based on sampling error. First, p-values are converted into z-scores. The variance of z-scores due to sampling error alone is expected to be approximately 1. However, the observed variance is only Var(z) = 0.032. A chi-square test shows that this observed variance is unlikely to occur by chance alone, p = .00035. Thus, there is strong evidence that the results were obtained with questionable research practices (p-hacked).
The last column transforms z-scores into a measure of observed power. Observed power is an estimate of the probability of obtaining a significant result under the assumption that the observed effect size matches the population effect size. These estimates are influenced by sampling error. To get a more reliable estimate of the probability of a successful outcome, the R-Index uses the average power across the 8 studies. The average is 54%. It is unlikely that a set of 8 studies with a 54% chance of obtaining a significant result produced significant results in all studies (Schimmack, 2012). Thus, once more we have evidence that the article reported too many significant results. The R-Index quantifies the inflation of the success rate by subtracting the observed power from the success rate (100% – 54% = 46%). This is close to the maximum discrepancy that is possible because the minimum value for observed power with a significant result is 50% (all power values below 50% imply p-values > .05).
To make matters worse, the probability of obtaining a significant result is inflated when a set of studies contains too many significant results. To correct for this bias, the R-Index computes the inflation rate. With 53% probability of success and 100% success rate, the inflation rate is 47%. To correct for inflation, the inflation rate is subtracted from median observed probability, which yields an R-Index of 53% – 47% = 6%. Based on this value, it is extremely unlikely that a researcher would obtain a significant result, if they would actually replicate the original studies exactly.
In short, we have positive evidence that the results reported in this article provide no credible evidence for the hypotheses. However, there is no evidence that Stapel simply made up data. Rather, he seems to have used questionable research practices that are considered acceptable until this day. Many articles that are not retracted also used these practices. This might also be true for some of Stapel’s articles that have not been retracted. To examine this, I conducted a z-curve analysis of Stapel’s articles that have not been retracted (data). This analysis relies on automatic extraction of all test-statistics rather than hand-coding of focal hypotheses.
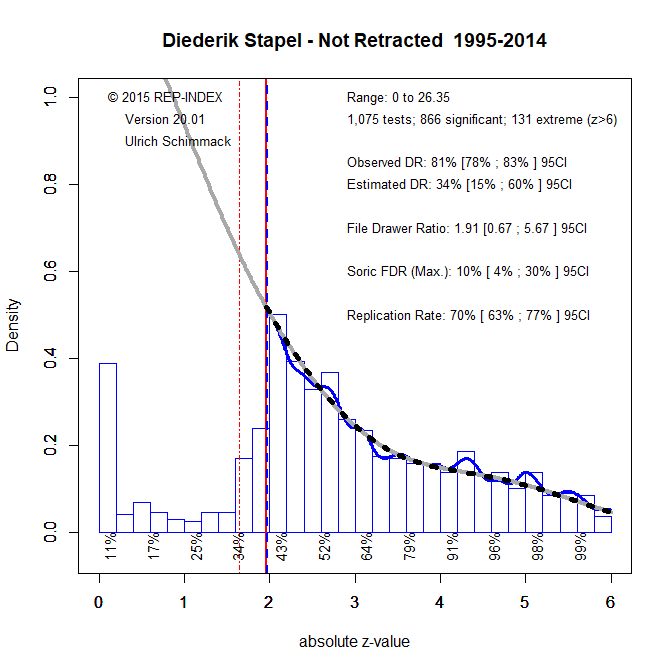
In a z-curve analysis, p-values are converted into z-scores and a model is used to fit the distribution of the significant values (z > 1.96). The key finding is that the program found 1,075 test statistics and 866 were significant. This is an observed discovery rate of 81%. However, there is clear evidence of publication bias because the mode of significant results is right at z = 1.96 and then there is a steep drop when results are not significant (z < 1.96). This is revealed by a comparison of the observed discovery rate and the expected discovery rate (34%). The 95%CI ranges from 15% to 60%. The fact that it does not include the ODR shows that questionable practices were used to inflate the percentage of significant results. So, even some articles that were not retracted used practices that led to the retraction of Stapel and Blanton (2004).
However, it is possible that Stapel made up data to match the p-values that other articles report. As most researchers used QRPs, it seemed normal that most p-values were between .05 and .005. So, he might have fabricated data to produce p-values in this range. To test this hypothesis I also conducted a z-curve analysis of retracted articles.
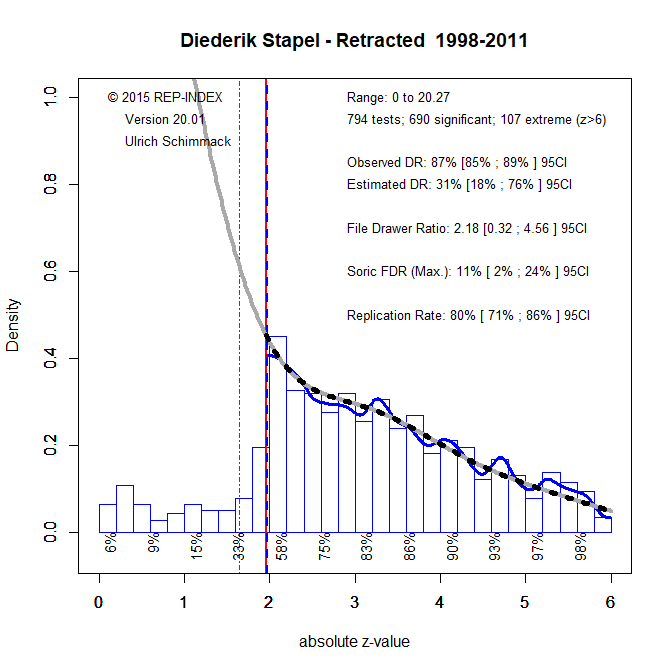
The results look very similar. Thus, it is not clear when Stapel used QRPs with real data and when Stapel made up fraudulent data that look similar to other p-values in the literature. However, in both cases, the data do not conform to distributions that are produced with proper scientific methods.
The main conclusion is that p-values below .05 in published articles are insufficient to claim a discovery. It is therefore necessary to find other ways to distinguish between credible and incredible evidence to support scientific claims about human social behavior.
Other articles by Stapel, show a different pattern. In the article “Moods as Spotlights: The Influence of Mood on Accessibility Effects” Stapel reports two studies and studies 2 and 3 also used “subliminal” priming.
Study Statistic p z OP
1 F(4,125)=16.14 0.000 6.45 1.00
2 F(1,72)=31.65 0.000 5.10 1.00
3 F(1,59)=11.43 0.001 3.22 0.90
Based on the reported statistics, we would believe that these results are highly replicable and had high power to produce significant results.
Median observed power is 1!
The only way these results would raise concerns is because it is not clear why these studies would produce so much stronger evidence than other studies.
Perhaps based on this kind of thing, we can work out which studies used completely fake data (or fake results, if he didn’t bother making up the data), and which merely used standard QRPs to massage the numbers into compliance (p<a).