This morning a tweet by Jeff Rouder suggested to take a closer look at an online first article published in Psychological Science.
When the Spatial and Ideological Collide
Metaphorical Conflict Shapes Social Perception
http://pss.sagepub.com/content/early/2016/02/01/0956797615624029.abstract

The senior author of the article is Yaacov Trope from New York University. The powergraph of Yaacov Trope suggests that the average significant result that is reported in an article is based on a study with 52% in the years from 2000-2012 and 43% in the recent years from 2013-2015. The difference is probably not reliable, but the results show no evidence that Yaacov Trope has changed research practices in response to criticism of psychological research practices over the past five years.
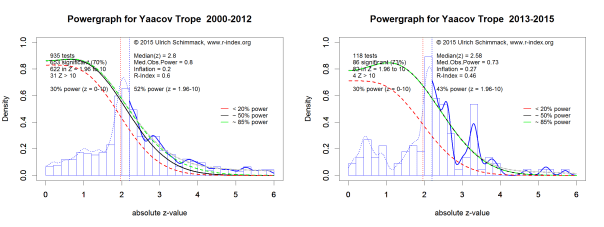
The average of 50% power for statistically significant results would suggest that every other test of a theoretical prediction produces a non-significant result. If, however, articles typically report that the results confirmed a statistical prediction, it is clear that dishonest reporting practices (excluding non-significant results or using undisclosed statistical methods like optional stopping) were used to present results that confirm theoretical predictions.
Moreover, the 50% estimate is an average. Power varies as a function of the strength of evidence and power for just significant results is lower than 50%. The range of z-scores from 2 to 2.6 approximately covers p-values in the range from .05 to .01 (just significant results). Average power for p-values in this range can be estimated by examining the contribution of the red (< 20% power), black (50% power) and green (85% power densities). In both graphs the density in this area is fully covered by the red and black lines, which implies that power is a mixture of 20% and 50%, which means power is less than 50%. Using the more reliable powergraph on the left, the red line (less than 20% power) covers a large portion of the area under the curve, suggesting that power for p-values between .05 and .01 is less than 33%.
The powergraph suggests that statistically significant results are only obtained with the help of random sampling error, reported effect sizes are inflated, and the probability of a false positive results is high because in underpowered studies the ratio of true positives vs. false positives is low.
In the article, Troope and colleagues report four studies. Casual inspection would suggest that the authors did conduct a rigorous program of research. They had relatively large samples (Ns = 239 to 410) and reported a priori power analyses that suggested they had 80% power to detect the predicted effects.
However, closer inspection with modern statistical methods to examine the robustness of results in a multiple study article show that the reported results cannot be interpreted at face value. To maintain statistical independence, I picked the first focal hypothesis test from each of the four studies.
CSV To HTML using codebeautify.org
| Study | N | statistic | p | z | obs.power |
|---|---|---|---|---|---|
| 1 | 239 | t(237)=2.06 | 0.04 | 2.053748911 | 0.537345692 |
| 2 | 391 | t(389)=2.33 | 0.02 | 2.326347874 | 0.642947245 |
| 3 | 410 | t(407)=2.13 | 0.03 | 2.170090378 | 0.583201432 |
| 4 | 327 | t(325)=2.59 | 0.01 | 2.575829304 | 0.730996408 |
TIVA
TIVA examines whether a set of statistical results is consistent with the expected amount of sampling error. When test-statistics are converted into z-scores, sampling error should produce a variance of 1. However, the observed variance in the four z-scores is Var(z) = .05. Even with just four observations, a left-tailed chi-square test shows that this reduction in variance would occur rarely by chance, p = .02. This finding is consistent with the powergraph that shows reduced variance in z-scores because non-significant results that are predicted by the power analysis are not reported or significant results were obtained by violating sampling assumptions (e..g, undisclosed optional stopping).
R-INDEX
The able also shows that median observed power is only 61%, indicating that the a priori power analyses systematically overestimate power because they used effect sizes that were larger than the reported effect sizes. Moreover, the success rate in the four studies is 100%. When the success rate is higher than median observed power, actual power is even lower than observed power. To correct for this inflation in observed power, the R-Index subtracts the amount of inflation (100 – 61 = 39) from observed power. The R-Index is 61 – 39 = 22. Simulation studies show that an R-Index of 22 is obtained when the null-hypothesis is true (the predicted effect does not exist) and only significant results are being reported.
As it takes 20 studies to get 1 significant result by chance when the null-hypothesis is true, this model would imply that Troope and colleagues conducted another 4 * 20 – 4 = 76 studies with an average of 340 participants (a total of 25,973 participants) to obtain the significant results in their study. This is very unlikely. It is much more likely that Troope et al. used optional stopping to produce significant results.
Although the R-Index cannot reveal how the reported results were obtained, it does strongly suggest that these reported results will not be replicable. That is, other researchers who conduct the same study with the same sample sizes are unlikely to obtain significant results although Troope and colleagues reported getting significant results 4 out of 4 times.
P-Curve
TIVA and R-Index show that the reported results cannot be trusted at face value and that the reported effect sizes are inflated. These tests do not examine whether the data provide useful empirical evidence. P-Curve examines whether the data provide evidence against the null-hypothesis after taking into account that the results are biased. P-Curve shows that the results in this article do not contain evidential value (p = .69); that is, after correcting for bias the results do not reject the null-hypothesis at the convential p < .05 level.
Conclusion
Statisticians have warned psychologists for decades that only reporting significant results that support theoretical predictions is not science (Sterling, 1959). However, generations of psychologists have been trained to conduct research by looking for and reporting significant results that they can explain. In the past five years, a growing number of psychologists have realized the damage of this pseudo-scientific method for advancing understanding of human behavior.
It is unfortunate that many well-established researchers have been unable to change the way they conduct research and that the very same established researchers in their roles as reviewers and editors continue to let this type of research being published. It is even more unfortunate that these well-established researchers do not recognize the harm they are causing for younger researchers who end up with publications that tarnish their reputation.
After five years of discussion about questionable research practices, ignorance is no longer an excuse for engaging in these practices. If optional stopping was used, it has to be declared in the description of the sampling strategy. An article in a top journal is no longer a sure ticket to an academic job, if a statistical analysis reveals that the results are biased and do not contain evidential value.
Nobody benefits from empirical publications without evidential value. Why is it so hard to stop this nonsense?
> It is even more unfortunate that these well-established researchers do not recognize the harm they are causing for younger researchers who end up with publications that tarnish their reputation.
> An article in a top journal is no longer a sure ticket to an academic job, if a statistical analysis reveals that the results are biased and do not contain evidential value.
As one of these younger researchers, I’d say that most of us are very aware of the reputational costs of publishing underpowered studies that lack evidential value. I see the state of the field changing before my eyes. I know the people in my department who sit on hiring committees and have an unwavering commitment to solid statistical planning and analysis.
But we’re disheartened by the fact that while we can’t use the same tricks to pave a path to tenure, people like Trope, Vohs, Baumeister, Cuddy, Grant, etc. still built very lucrative careers out of quick, sexy, meaningless studies of 40-60 undergraduates. Falsifying data will ruin your career, but no one has lost tenure for publishing dozens of articles with zero evidential value. Being badmouthed by a bunch of statisticians isn’t so bad when you have a TED talk with 20m+ viewers, a tenured position at an elite university, write regularly in the NYT, and are the face of social psychology to millions of people who don’t work in the field.
Having attempted to publish some very high-powered failures to replicate decades-old effects in social decision-making, I can say that the peer review process at the top psych journals is still controlled by those who built their careers on mountains of this nonsense. If you happen to have a co-author who’s active in the replication movement (e.g. the PIs who tend to read this and related blogs) you can’t be denied, but if you’re trying to make it on your own then it doesn’t matter if you have an order of magnitude more participants and find a null effect.
Some of the students in my department realize this and choose to play along, running 10-15 quick studies every year in the hopes that they get lucky with one or two. Those older students who really value rigorous experimental design and statistical power seem to be graduating and moving into private industry where the stakes are higher than one’s own reputation.
Things are improving, and quickly, but this in-between renaissance period can be terrible for grad students who have dreamed of academia for the better part of a decade and are torn between one path or the other.
I know how hard it is to do good science that does not produce 20 publications before you even get a Ph.D.
I can only say that I waited long enough (5 years since 2011) for everybody to get the message and for everybody to have an opportunity to check themselves and to change research practices.
Time is up. No more excuses. If you continue to do questionable research own it, because everybody gets to hear about it.
A year or two ago, there was a lot of discussion about “tone” and criticism of calling out researchers by name for conducting poor studies, including of this blog. I have never heard a single concern about “tone” from anyone without a tenure-track job. From the top, the replication movement is beautiful, powerful, wonderful. From the bottom, it appears that it is only being allowed to grow in quarantine. Yes, publish your null results in an RRR. Get a well-known replication crusader on-board and we’ll allow you to preregister. But if we haven’t heard of you before, well you’re probably not experienced enough with these things and I just don’t think your work is appropriately suited for our journal’s audience – you may wish to try one of those other journals that no one reads.
I used to agree with the criticisms of tone. Some of the most active people in the replication movement seemed like arrogant jerks. Now, a few years into a PhD, I’ve had a closer view of the results of the glacial progress in our field. And I’ve seen far too many brilliant minds take jobs in private industry. I shudder when I think of the life-changing discoveries they will make that will never be known to the world at large because they simply couldn’t survive in the corrupt publish-or-perish system. As you say, this movement is no longer new. It has been born, learned to crawl, walk, and talk, and is now beginning primary school. Five years is simply too long to only achieve open data, some RRRs, and some great blogs.
Public shaming may be the only thing left that can speed the renaissance. Keep shouting it from the rooftops.
“If optional stopping was used, it has to be declared in the description of the sampling strategy. ”
From the article:
Study 1:”We selected a target sample size of 240 on the basis of an a priori power analysis indicating that such a sample size would provide approximately 80% power to detect a small to medium effect (d≈ 0.35).”
Study 2:”We selected a target sample size of 380 on the basis of an
a priori analysis indicating that such a sample size would provide at least 80% power to detect the weighted aver-age of the effects from Study 1 (d = 0.29). ”
Study 3:”We selected a target sample size of 400 on the basis of an a priori analysis indicating that such a sample size would provide around 80% power to detect a small to medium effect (f = .16) in an omnibus analysis of variance with three conditions.”
Study 4:”We selected a target sample size of 340 on the basis of an a priori analysis indicating that such a sample size would provide around 80% power to detect the weighted aver-age of the effect sizes from Study 1 (d = .29).”
In the Psychological Science authors guidelines (http://www.psychologicalscience.org/index.php/publications/journals/psychological_science/ps-submissions#STAT) it is stated that:
“The manuscript submission portal has a section containing checkboxes for four Disclosure Statement items (….)
For each study reported in your manuscript, check the boxes below to:
(…)
(4) Confirm that (a) how sample size in each study was determined and (b) your data-collection stopping rule have been reported in the Method section(s). [ ] ”
I couldn’t find anything written in the article about the data-collection stopping rule, so technically it could be that the authors didn’t adhere all to the PsychScience guidelines and this wasn’t caught by any of the reviewers.
My guess would however be that writing that they selected a “target sample” based on power calculations implies that they decided upfront how many participants they aimed for. My guess would be that they did not use optional stopping: their target sample size is based on power calculations (in some cases involving previous studies) and the final sample sizes are close to the target sample sizes.
I wonder what the authors, reviewers, and the journal could have done better in this case. As you state:”Casual inspection would suggest that the authors did conduct a rigorous program of research. They had relatively large samples (Ns = 239 to 410) and reported a priori power analyses that suggested they had 80% power to detect the predicted effects.”.
Are we expecting them to perform all kinds of analyses to look for the evidential value of the studies as well?
And, if optional stopping was not used, how can the results, and the results of your analyses be explained?
(p.s. i hope one of the authors will reply to this post and can make clear if they used optional stopping or not, and/or release other information which can possibly help explain things further)
Thank you for your comment.
I am just speculating that optional stopping was used to explain the statistical results.
I agree that optional stopping would be dishonest because it was not mentioned and the article was written as if a fixed sample size was planned a priori.
I agree that it would be interesting to hear from the authors, but usually authors are not very open to revealing their research practices (see responses to Francis’s commentaries).